Dashboard
This section describes how to use the dashboard of Spring Cloud Data Flow.
33. Introduction
Spring Cloud Data Flow provides a browser-based GUI called the Dashboard to manage the following information:
-
Apps: The Apps tab lists all available applications and provides the controls to register and unregister them.
-
Runtime: The Runtime tab provides the list of all running applications.
-
Streams: The Streams tab lets you list, design, create, deploy, and destroy Stream Definitions.
-
Tasks: The Tasks tab lets you list, create, launch, schedule, and destroy Task Definitions.
-
Jobs: The Jobs tab lets you perform batch job related functions.
Upon starting Spring Cloud Data Flow, the dashboard is available at:
For example, if Spring Cloud Data Flow is running locally, the dashboard is available at localhost:9393/dashboard.
If you have enabled HTTPS, the dashboard is available at localhost:9393/dashboard.
If you have enabled security, a login form is available at localhost:9393/dashboard/#/login.
The default Dashboard server port is 9393.
|
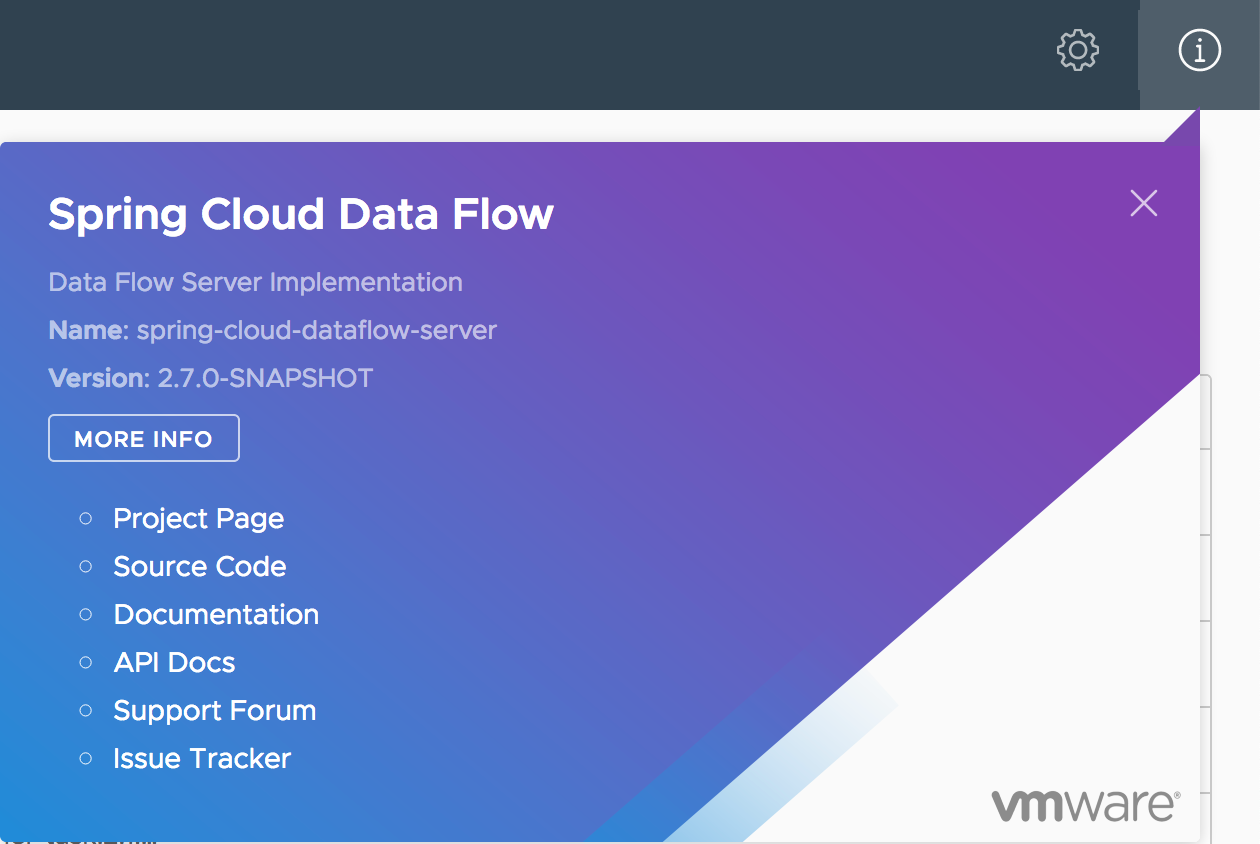
The following image shows the opening page of the Spring Cloud Data Flow dashboard:
34. Apps
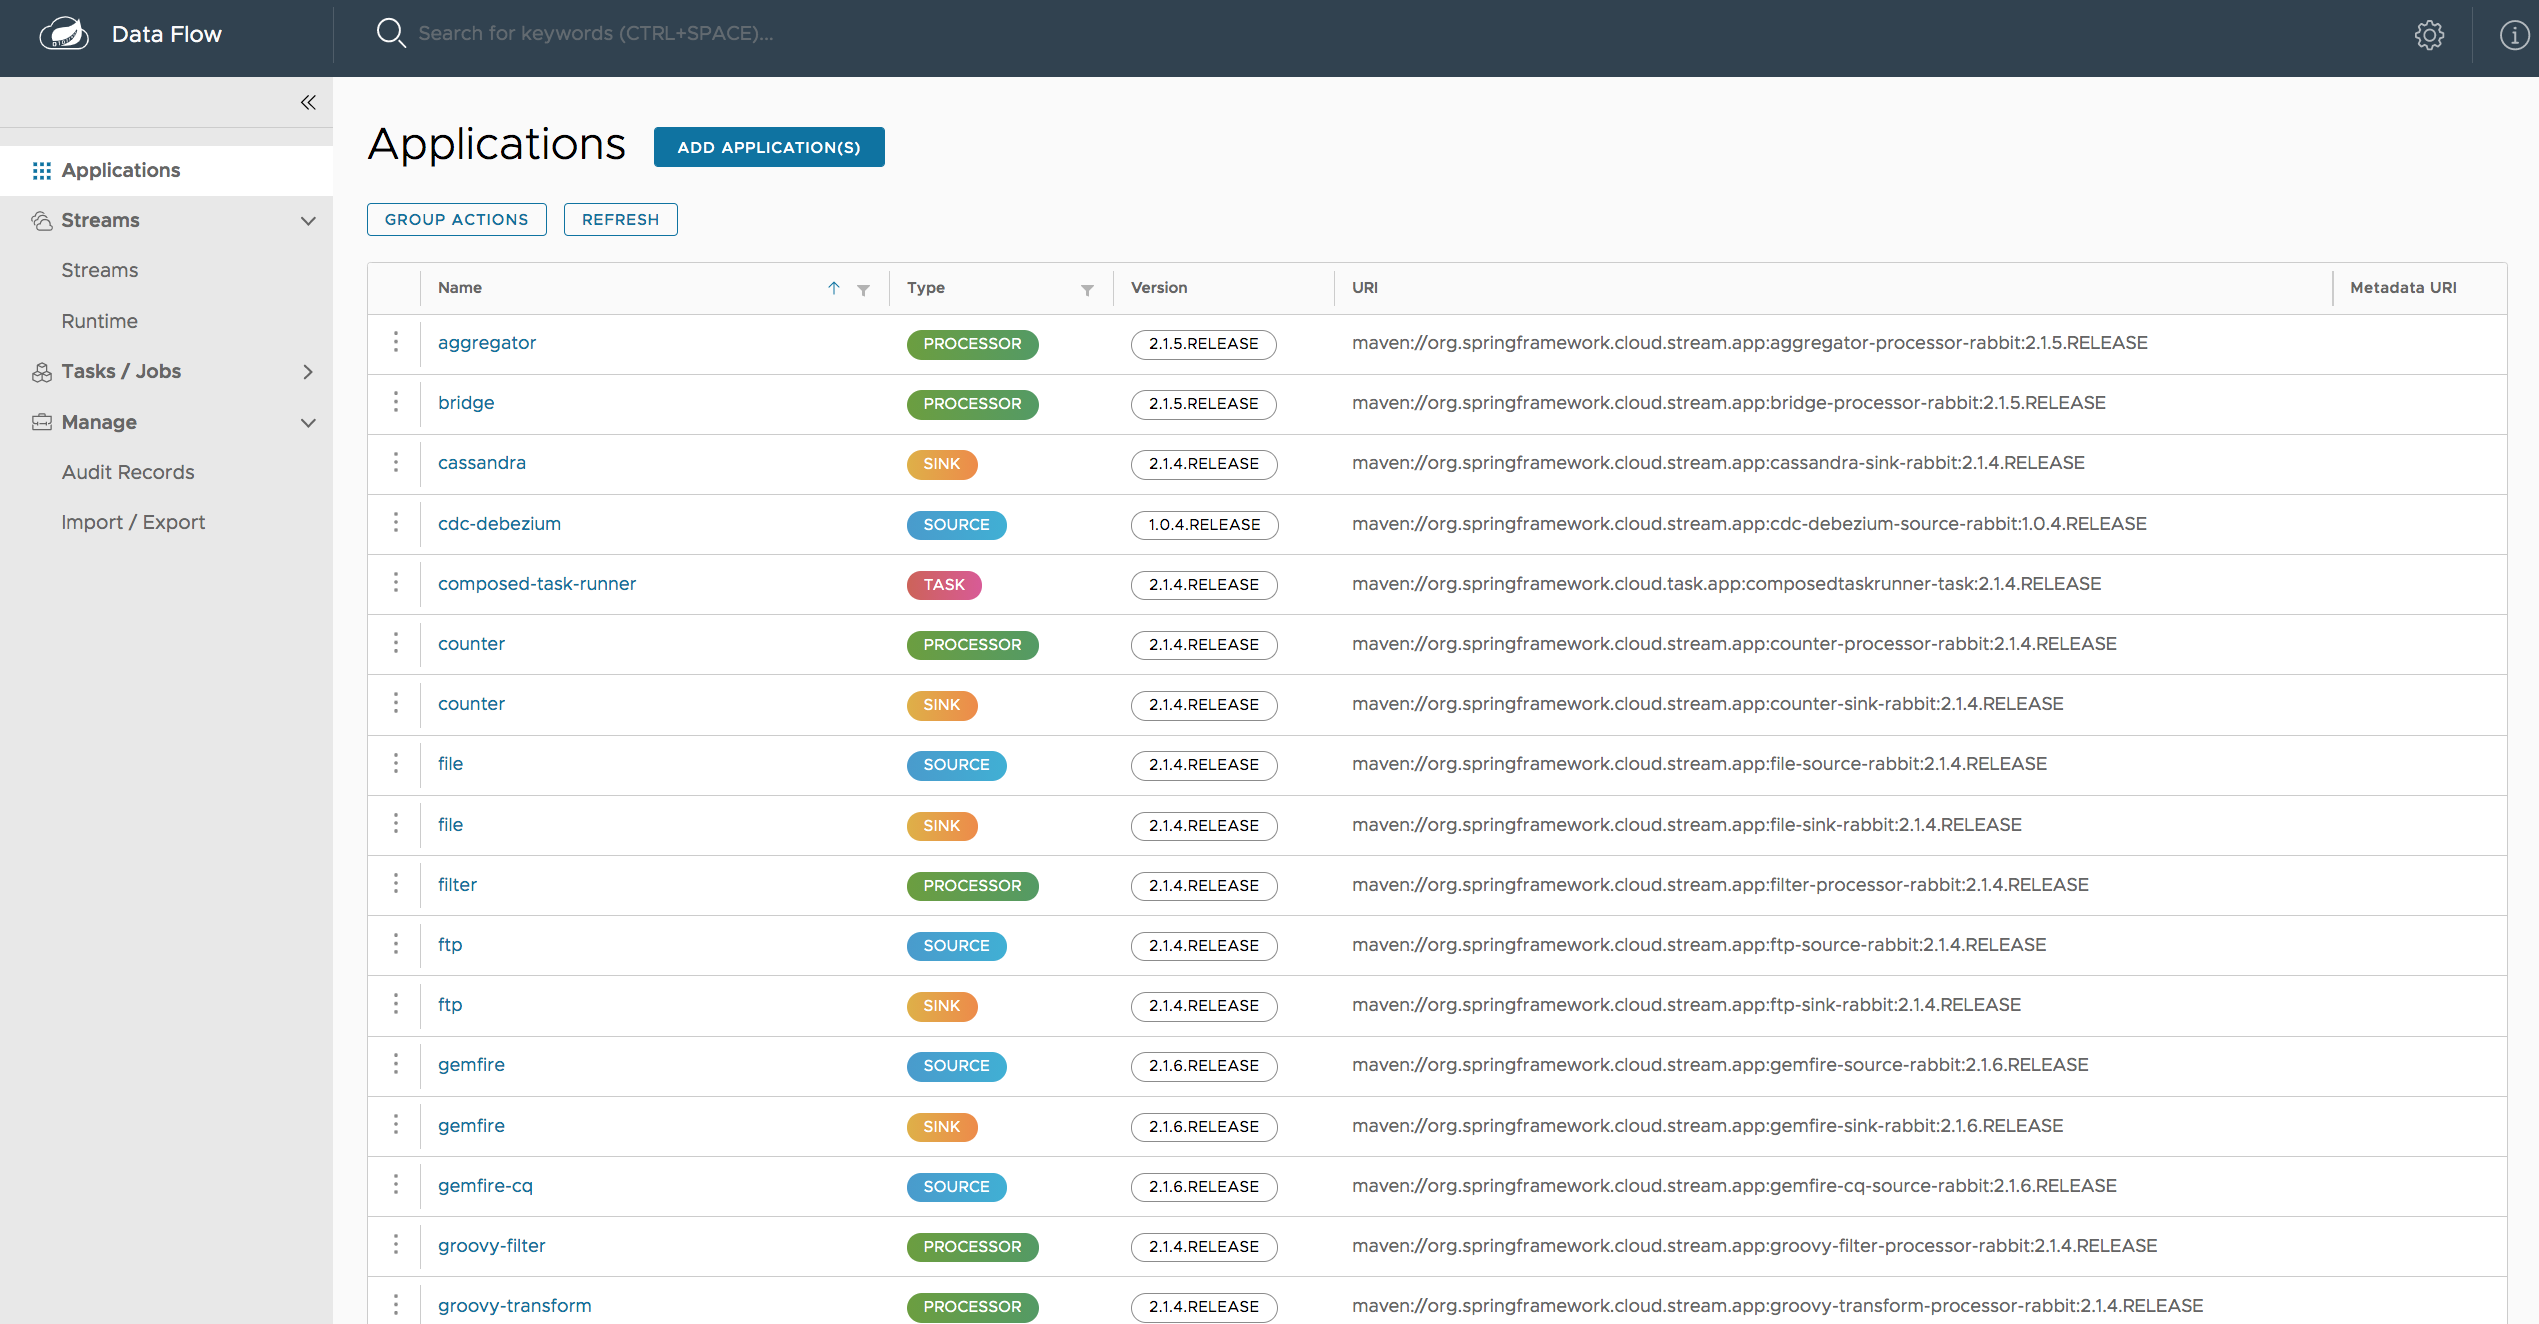
The Applications tab of the dashboard lists all the available applications and provides the controls to register and unregister them (if applicable). You can import a number of applications at once by using the Bulk Import Applications action.
The following image shows a typical list of available applications within the dashboard:
34.1. Bulk Import of Applications
Applications can be imported in numerous ways which are available on the "Applications" page. For bulk import, the application definitions are expected to be expressed in a properties style, as follows:
<type>.<name> = <coordinates>The following examples show typical application definitions:
task.timestamp=maven://org.springframework.cloud.task.app:timestamp-task:1.2.0.RELEASE
processor.transform=maven://org.springframework.cloud.stream.app:transform-processor-rabbit:1.2.0.RELEASE
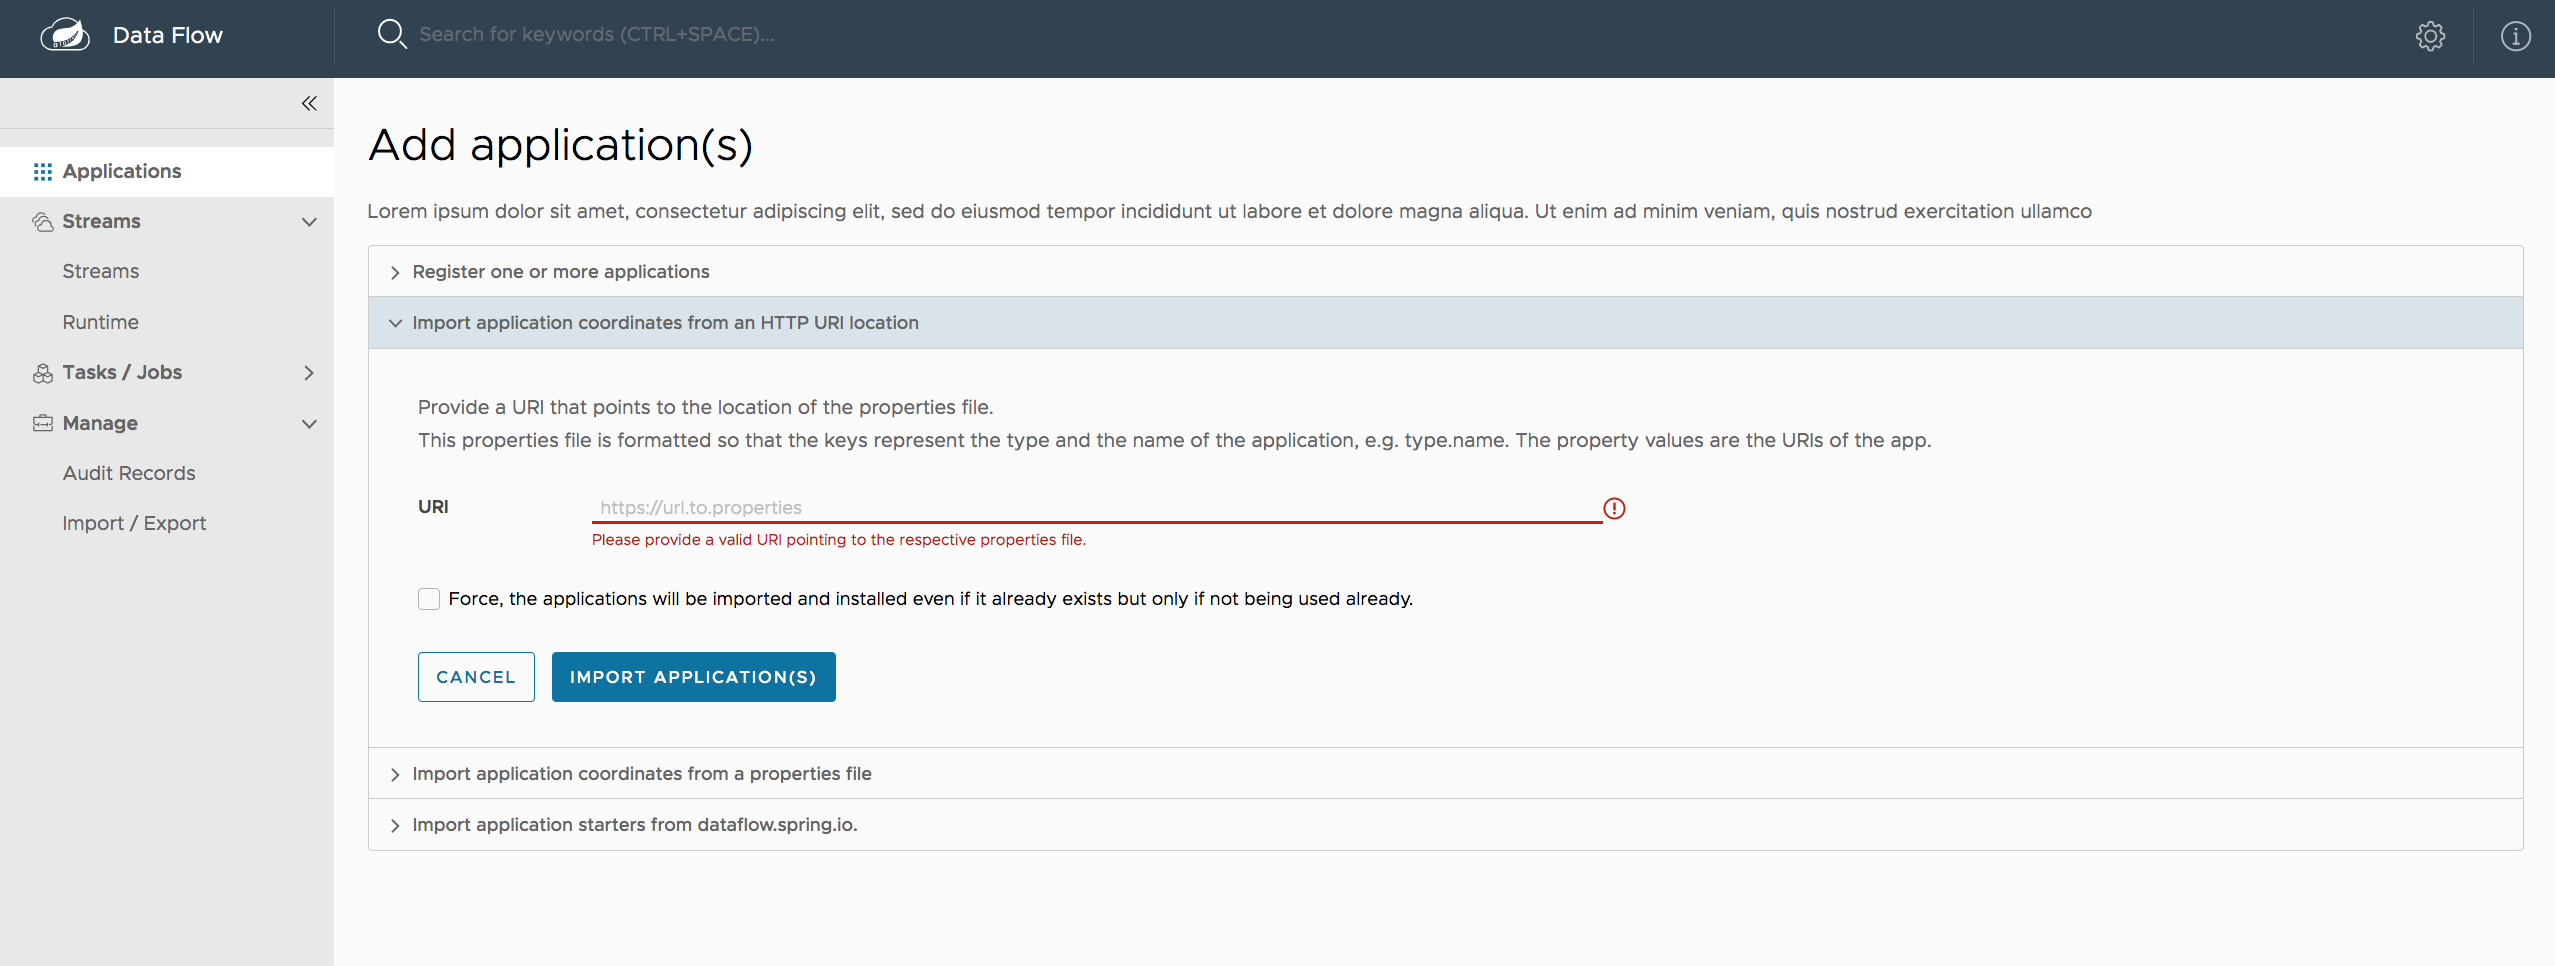
In the "Import application coordinates from an HTTP URI location" section, you can specify a URI that points to a properties file stored elsewhere, it should contain properties formatted as shown in the previous example. Alternatively, by using the Apps as Properties textbox in the "Import application coordinates from a properties file" section , you can directly list each property string. Finally, if the properties are stored in a local file, the Import a File option opens a local file browser to select the file. After setting your definitions through one of these routes, click Import Application(s).
The following image shows an example page of one way to bulk import applications:
35. Runtime
The Runtime tab of the Dashboard application shows the list of all running applications. For each runtime applicaiton, the state of the deployment and the number of deployed instances is shown. A list of the used deployment properties is available by clicking on the application ID.
The following image shows an example of the Runtime tab in use:

36. Streams
The Streams tab has two child tabs: Definitions and Create Stream. The following topics describe how to work with each one:
36.1. Working with Stream Definitions
The Streams section of the Dashboard includes the Definitions tab that provides a listing of stream definitions. There you have the option to deploy or undeploy those stream definitions. Additionally, you can remove the definition by clicking on Destroy. Each row includes an arrow on the left, which you can click to see a visual representation of the definition. Hovering over the boxes in the visual representation shows more details about the applications, including any options passed to them.
In the following screenshot, the timer stream has been expanded to show the visual representation:

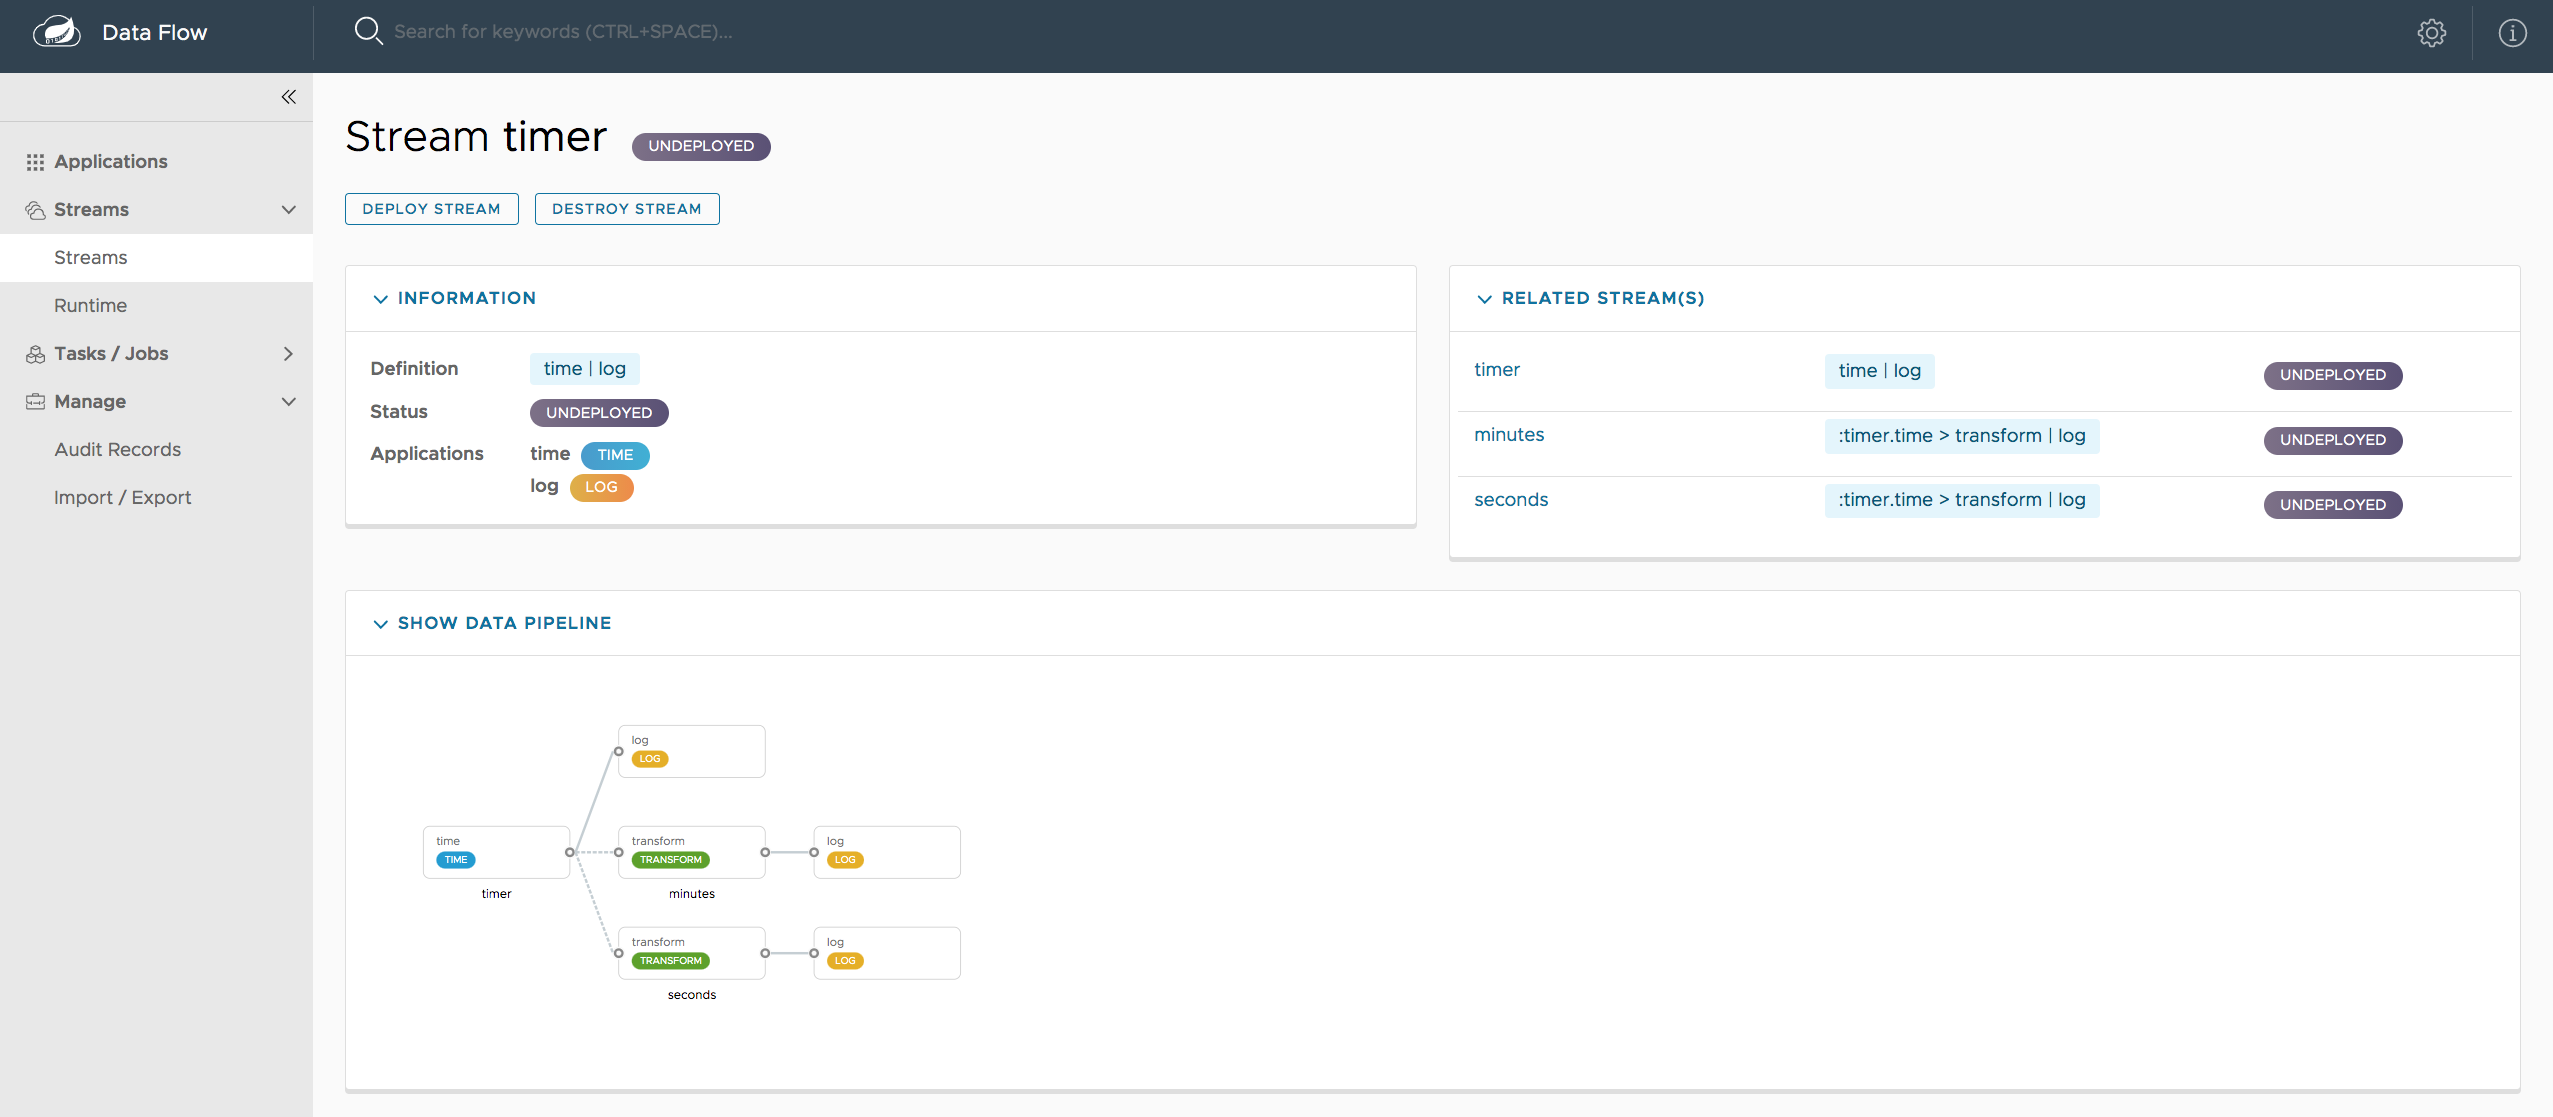
If you click the details button, the view changes to show a visual representation of that stream and any related streams.
In the preceding example, if you click details for the timer stream, the view changes to the following view, which clearly shows the relationship between the three streams (two of them are tapping into the timer stream):
36.2. Creating a Stream
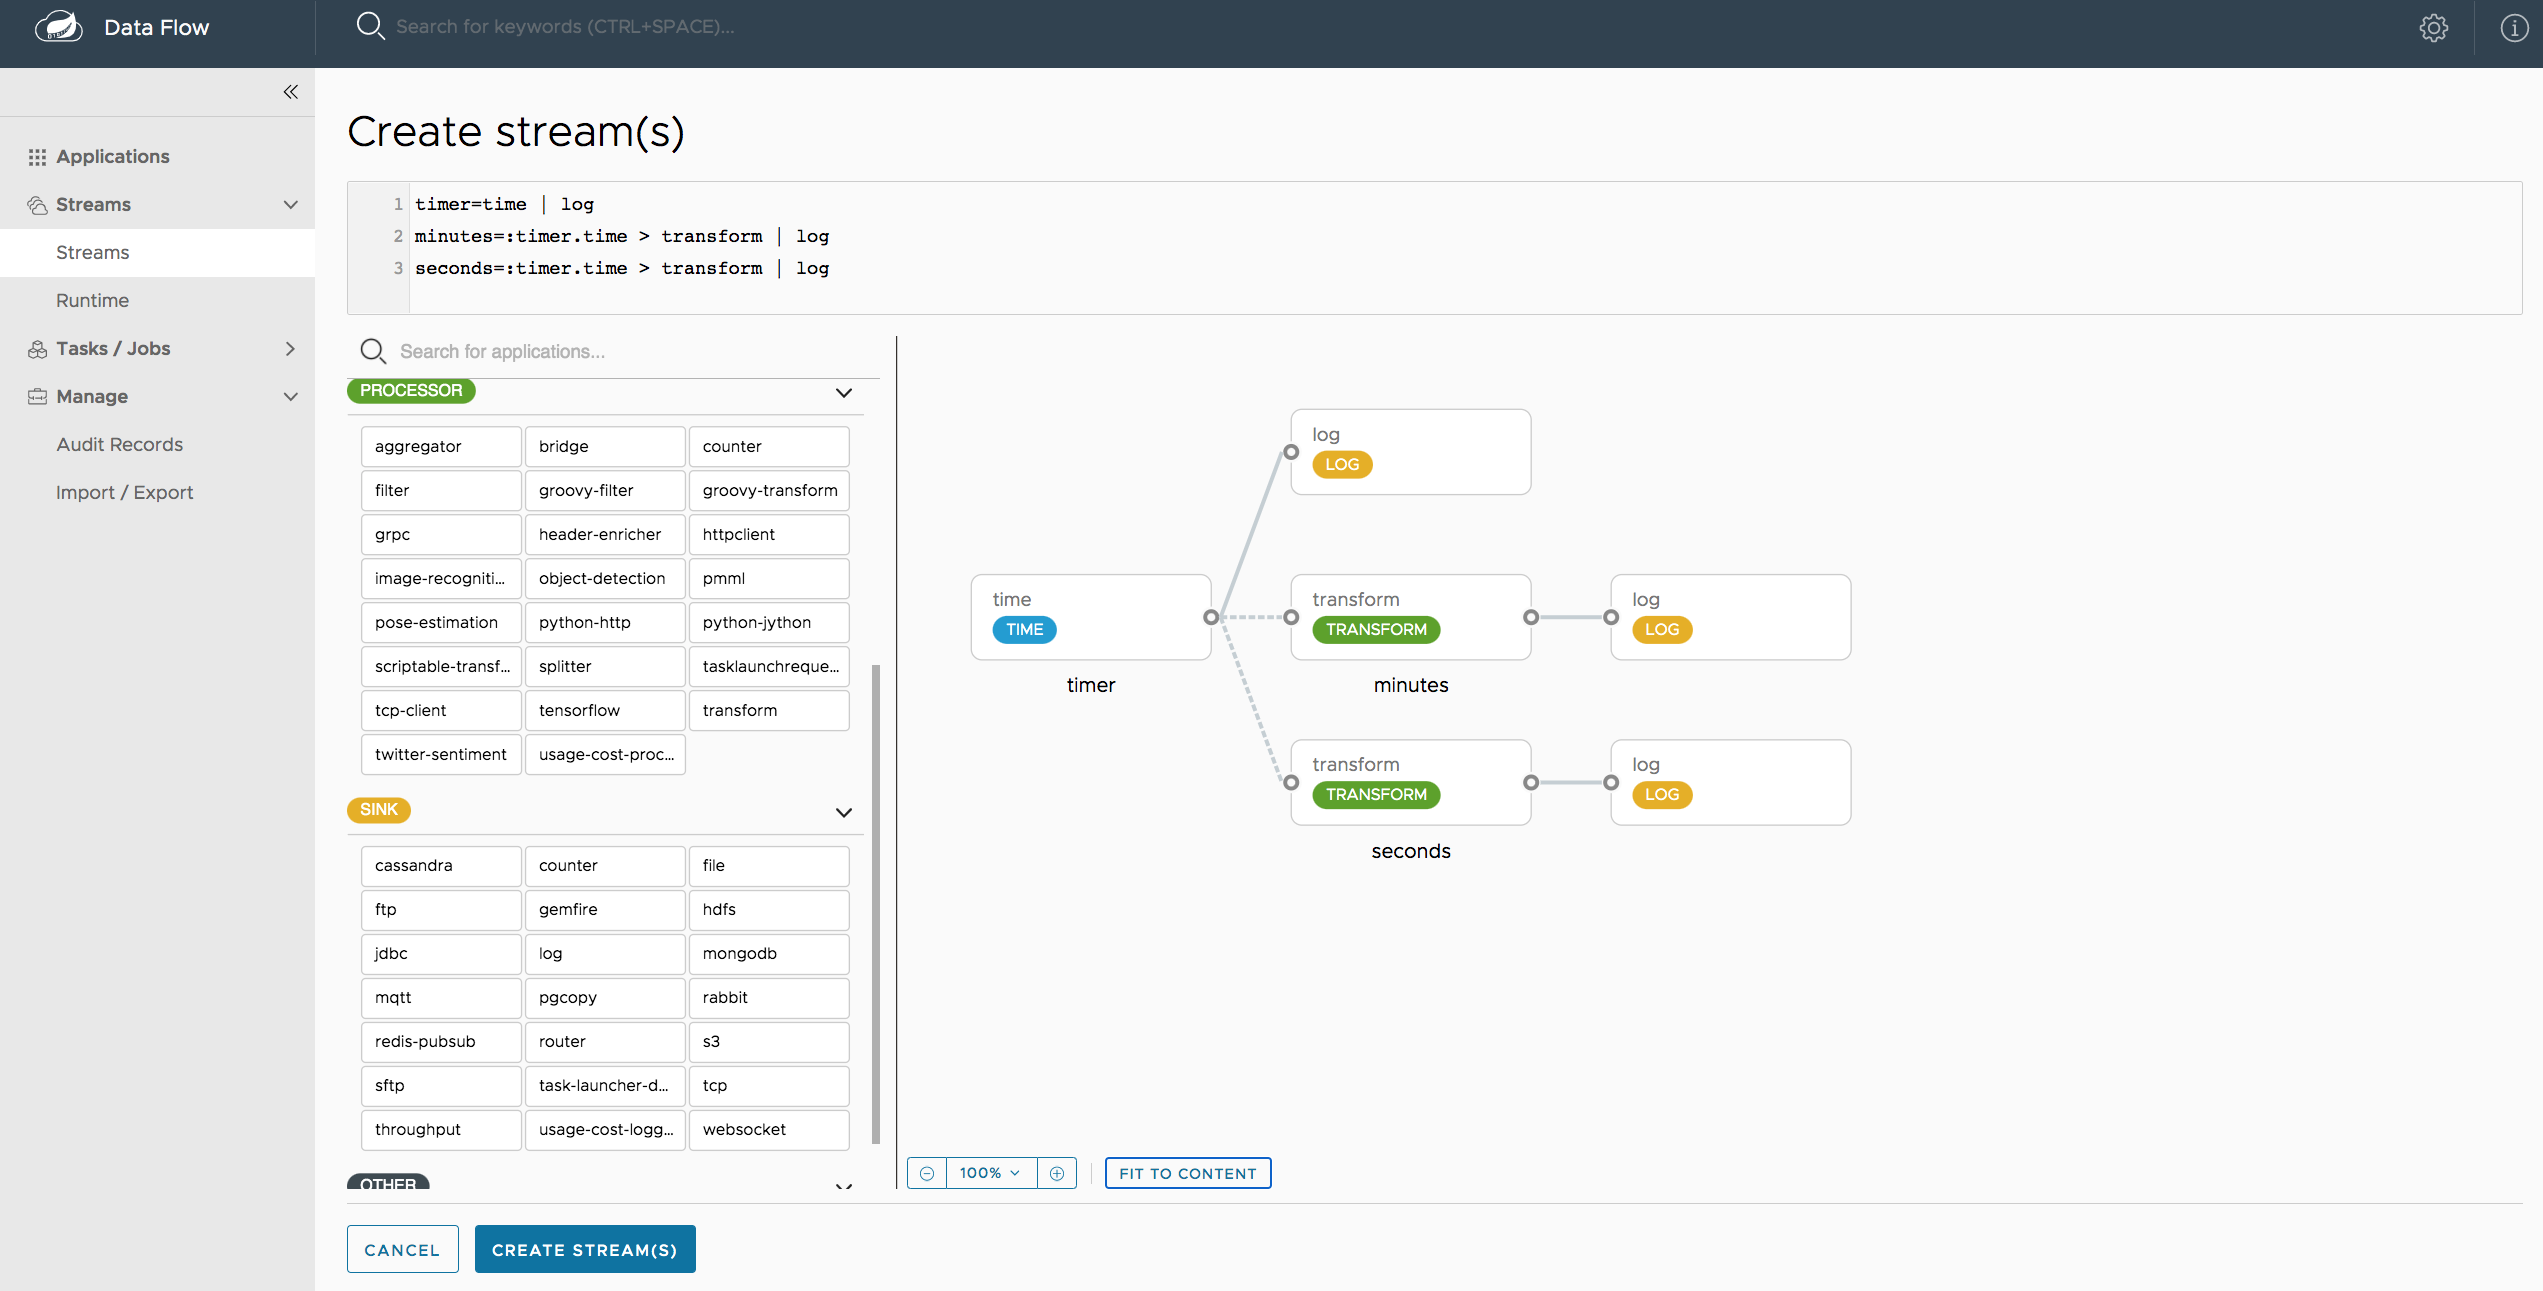
The Streams section of the Dashboard includes the Create Stream tab, which makes the Spring Flo designer available. The designer is a canvas application that offers an interactive graphical interface for creating data pipelines.
In this tab, you can:
-
Create, manage, and visualize stream pipelines by using DSL, a graphical canvas, or both
-
Write pipelines by using DSL with content-assist and auto-complete
-
Use auto-adjustment and grid-layout capabilities in the GUI for simpler and interactive organization of pipelines
You should watch this screencast that highlights some of the "Flo for Spring Cloud Data Flow" capabilities. The Spring Flo wiki includes more detailed content on core Flo capabilities.
The following image shows the Flo designer in use:
36.3. Deploying a Stream
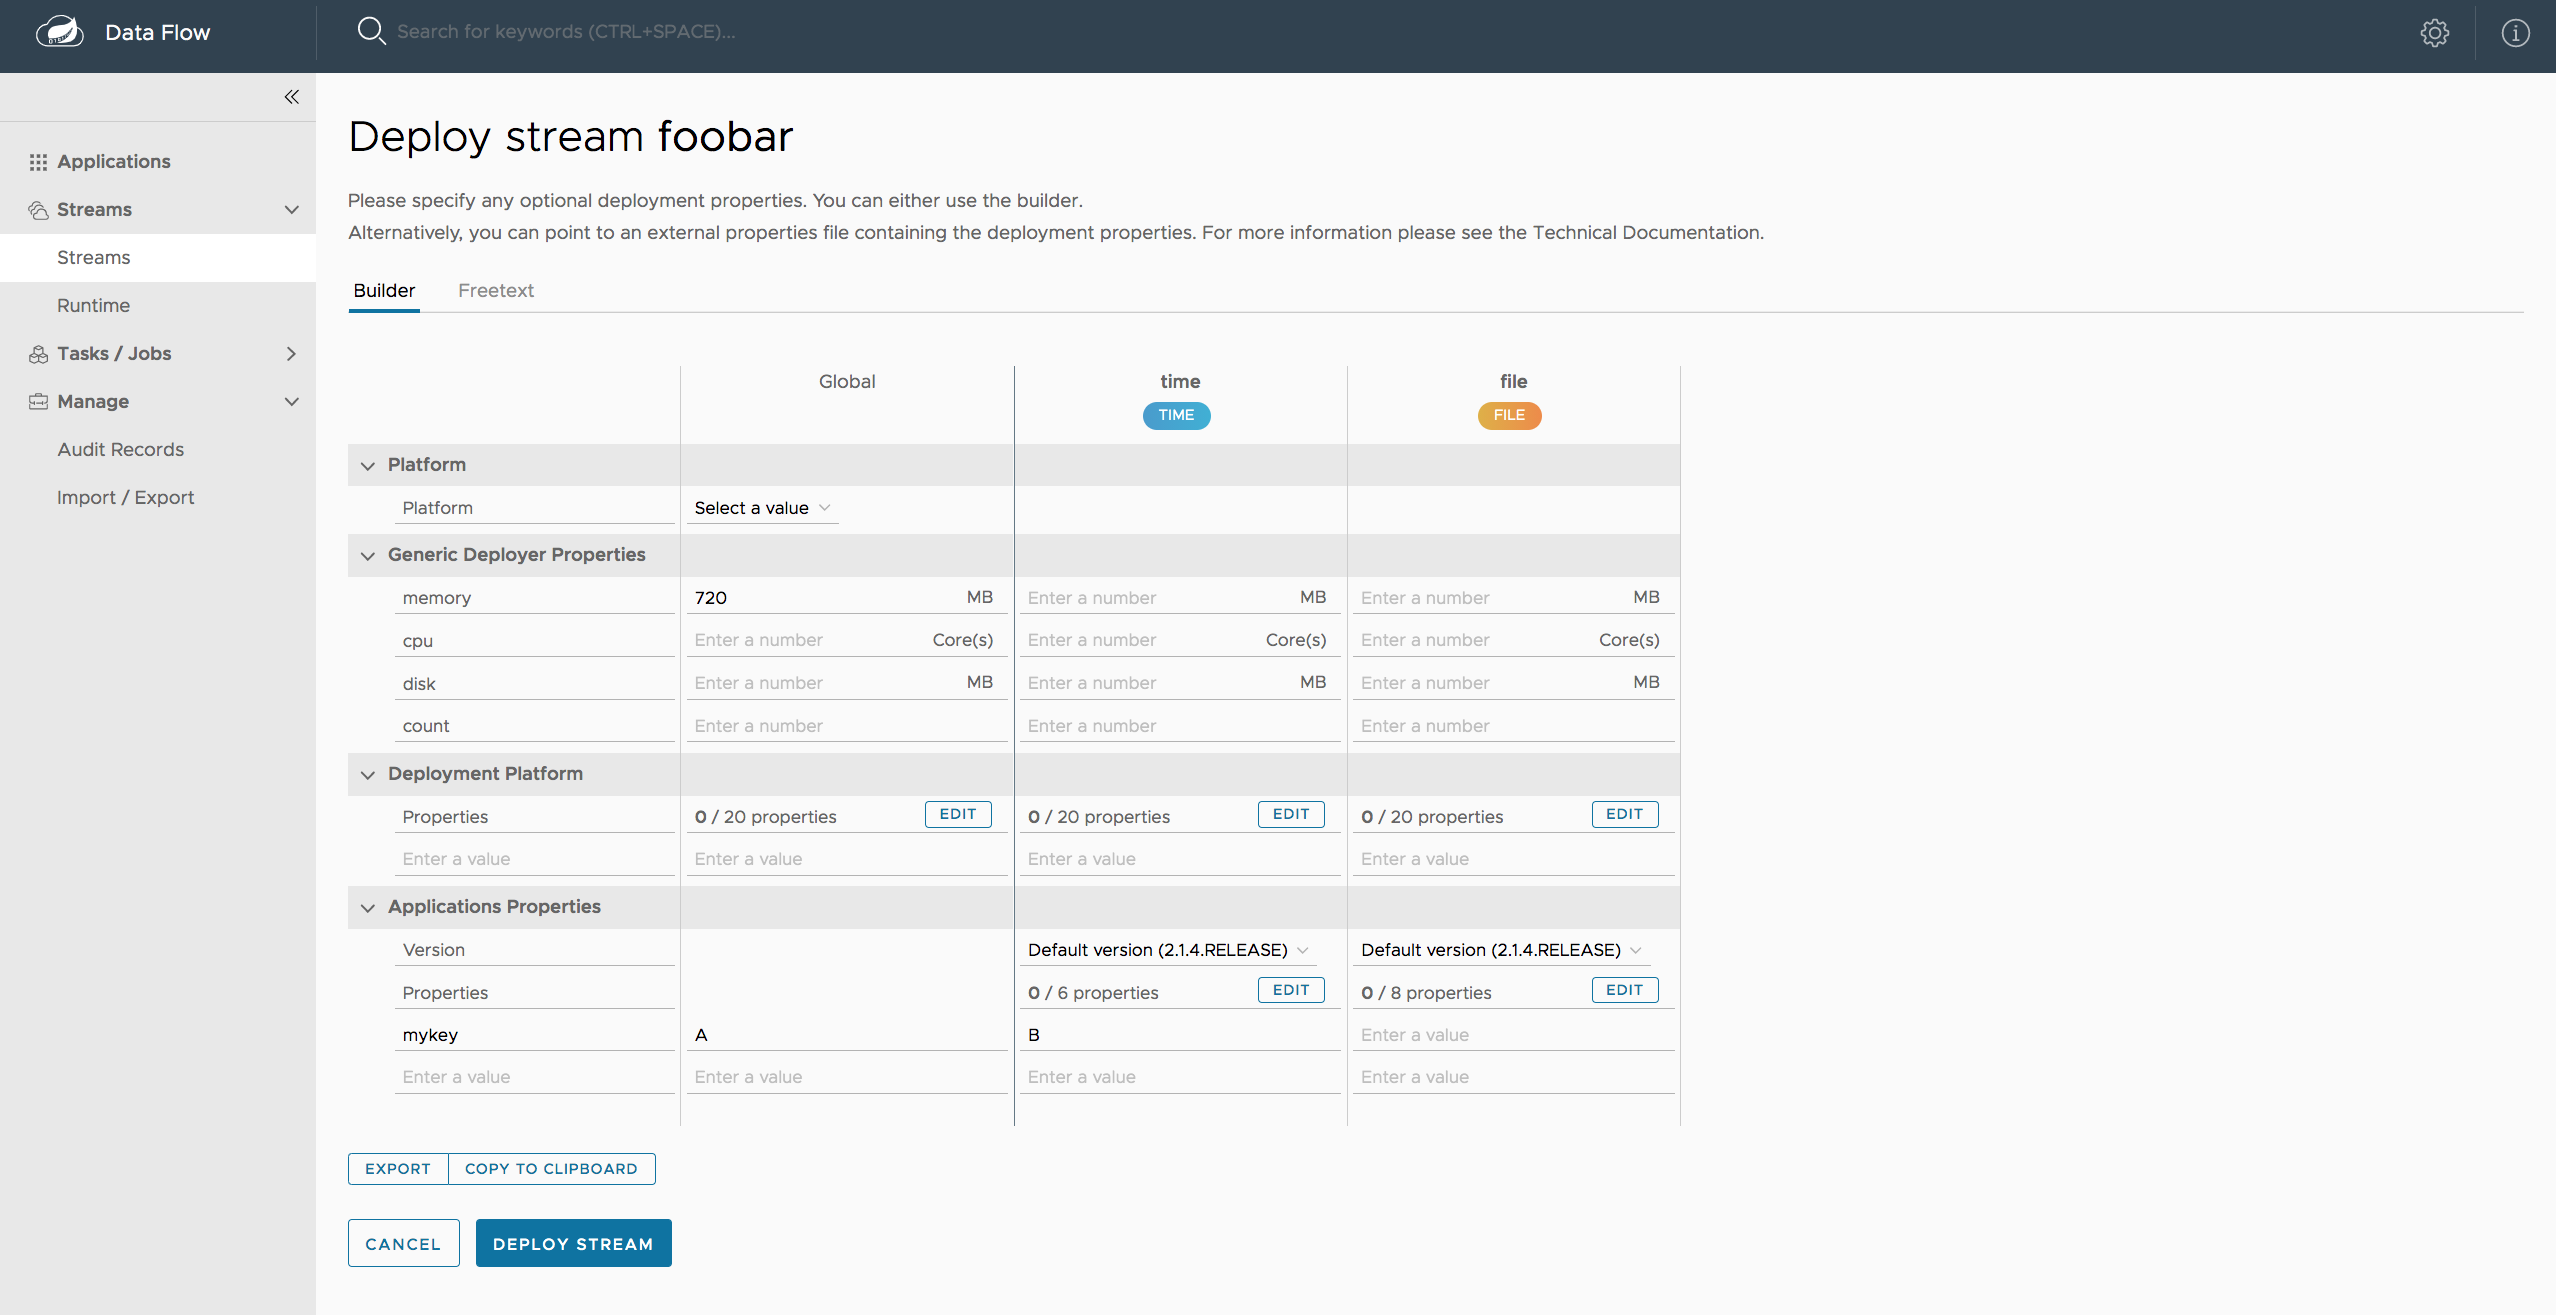
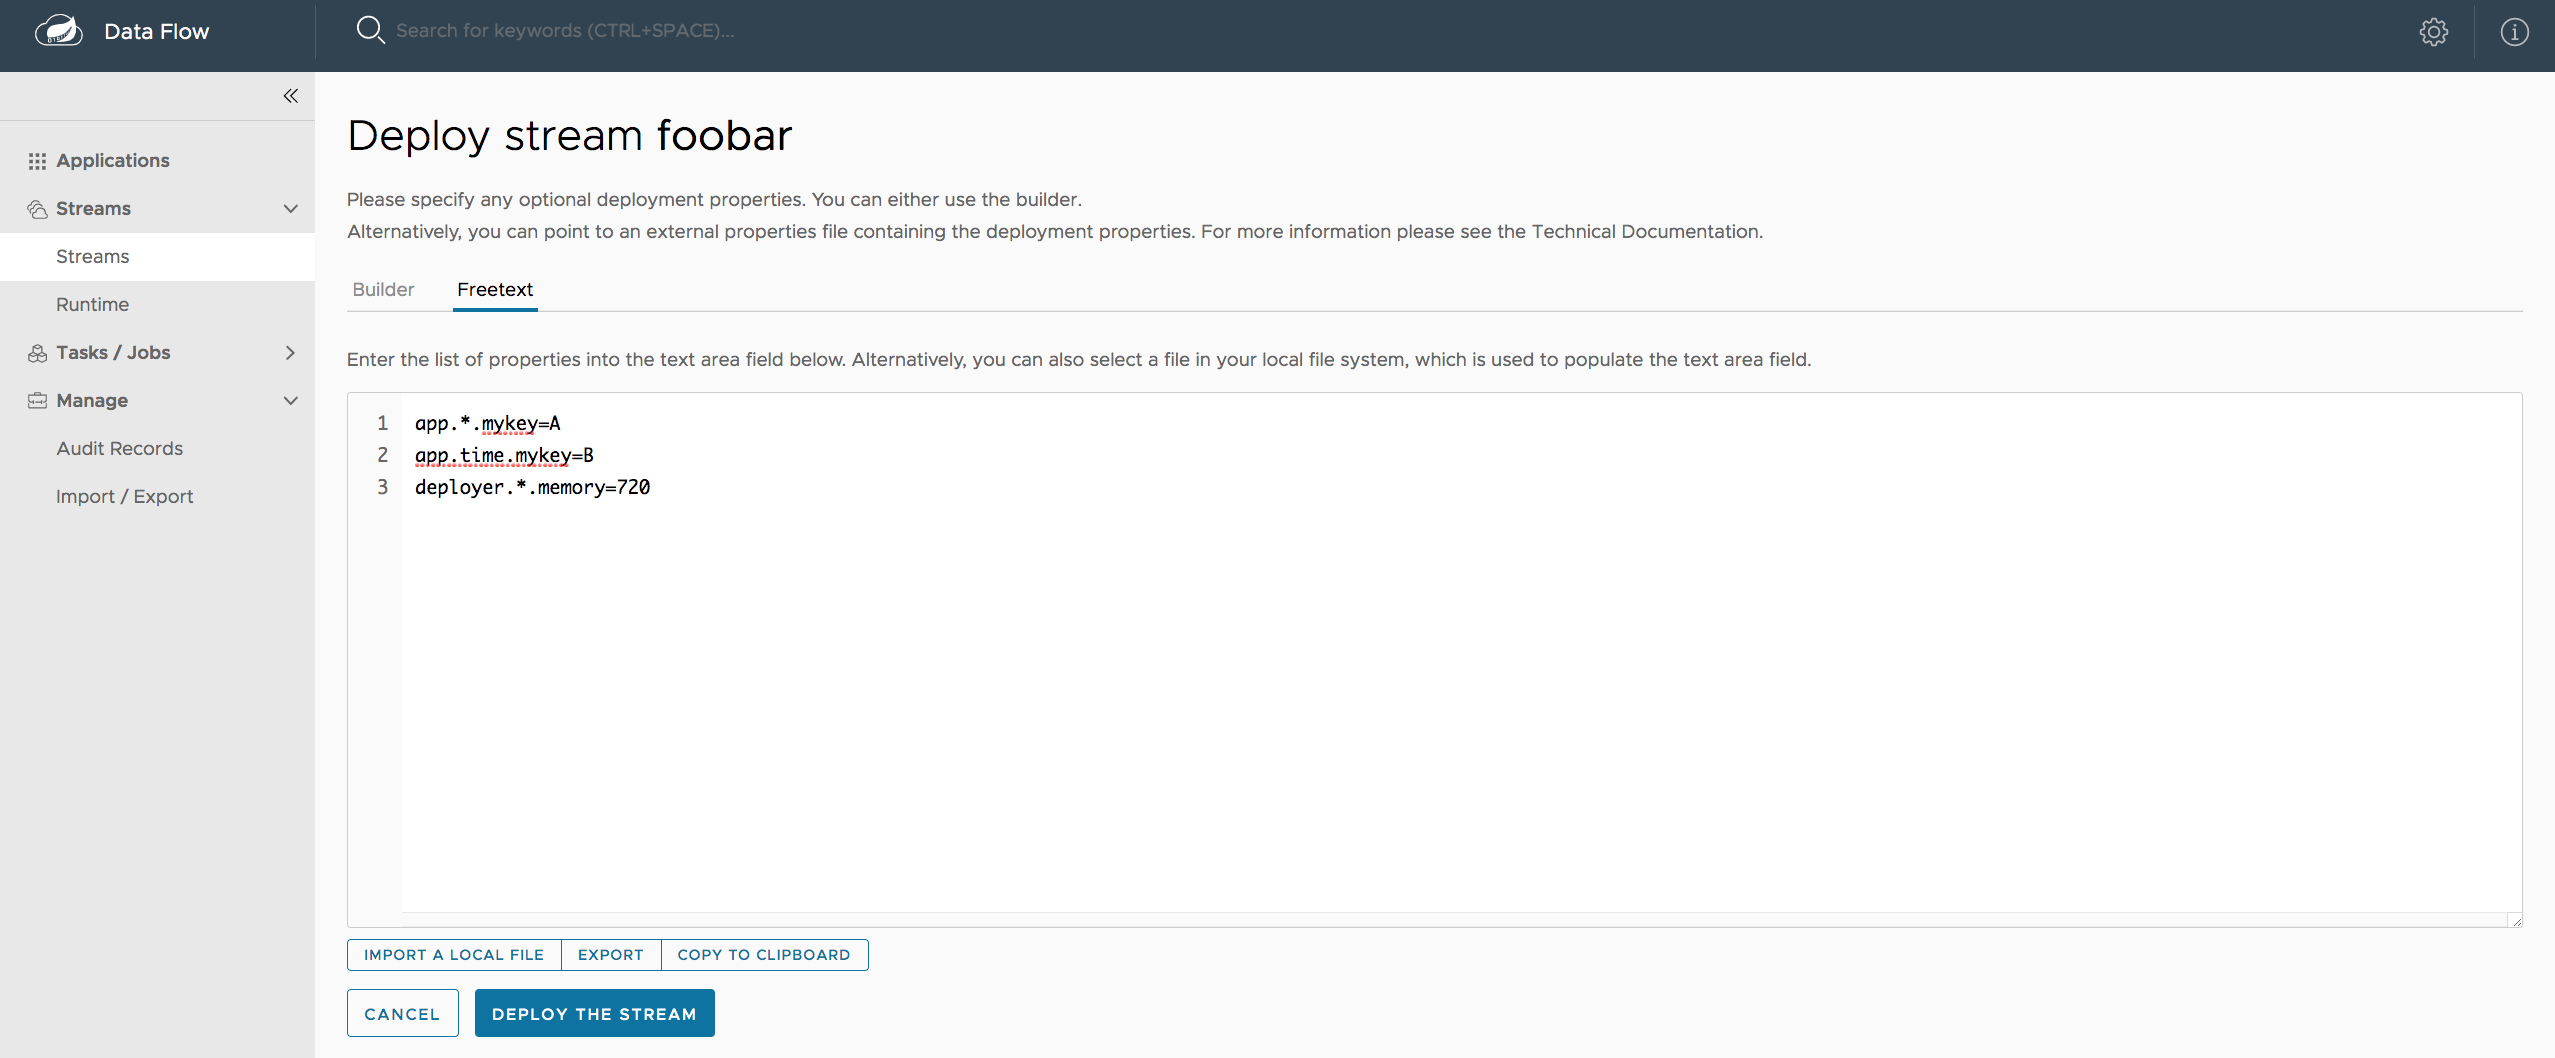
The stream deploy page includes tabs that provide different ways to set up the deployment properties and deploy the stream.
The following screenshots show the stream deploy page for foobar (time | log).
You can define deployments properties by using:
-
Form builder tab: a builder that helps you to define deployment properties (deployer, application properties, and so on)
-
Free text tab: a free text area (for key-value pairs)
You can switch between both views.
| The form builder offers stronger validation of the inputs. |
36.4. Accessing Stream Logs
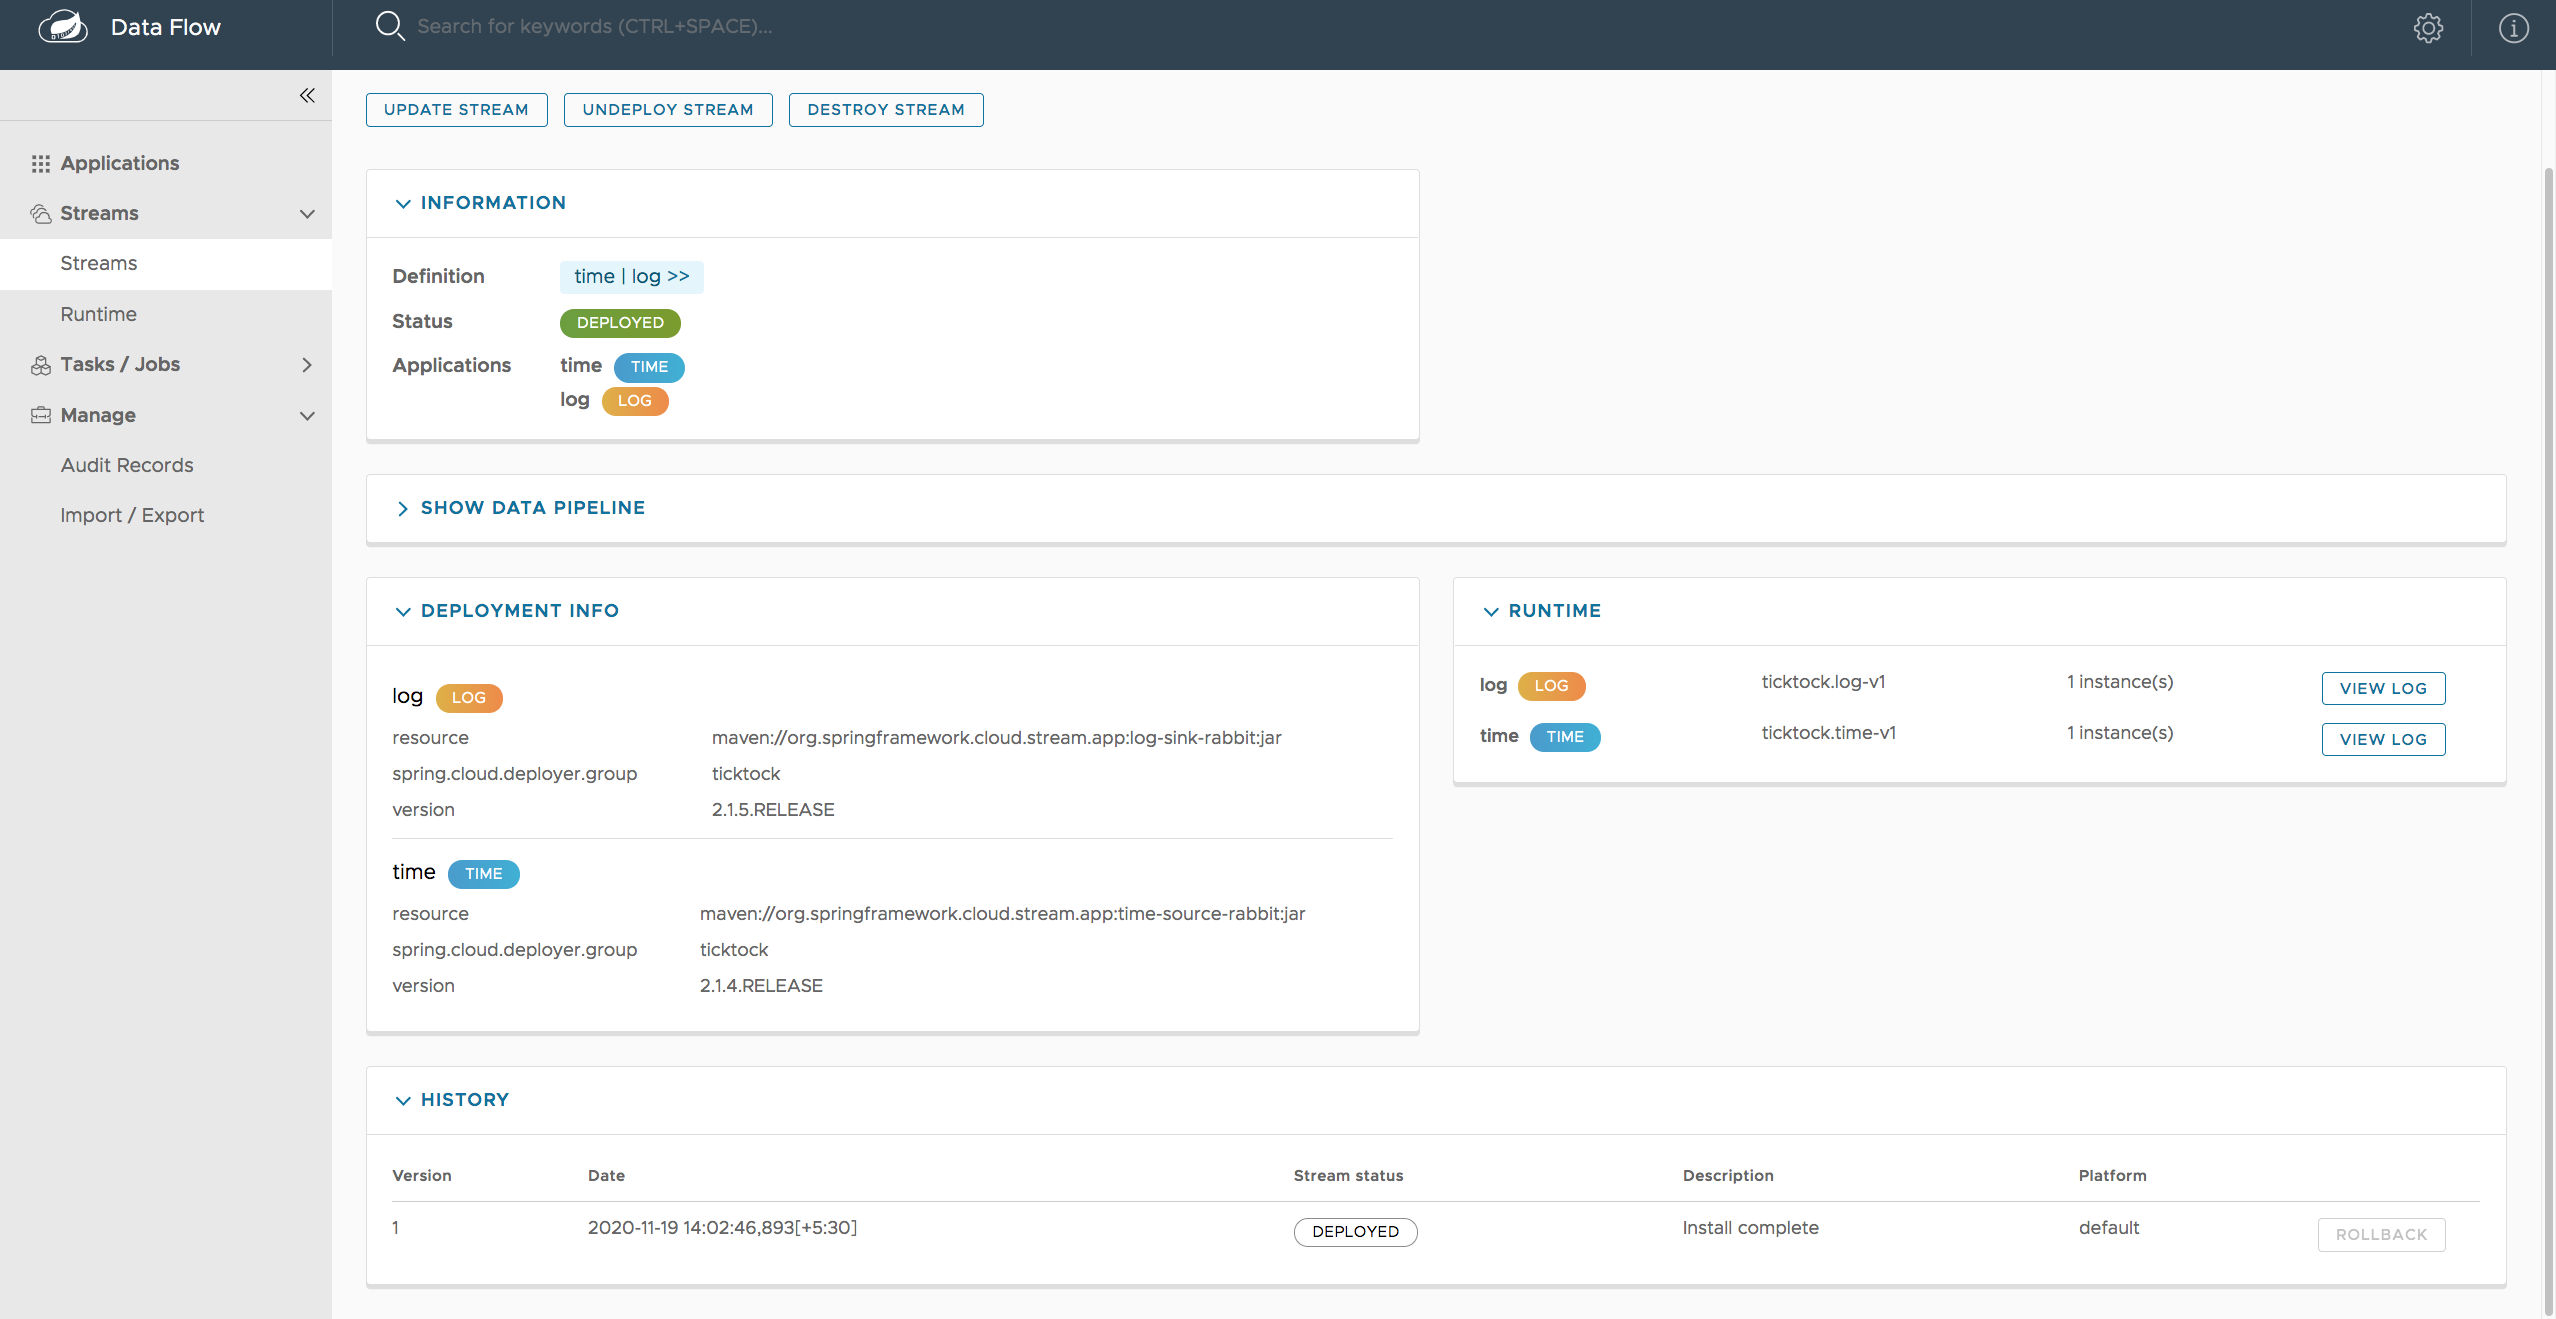
Once the stream applications are deployed, their logs can be accessed from the Stream summary page, as the following image shows:
36.5. Creating Fan-In and Fan-Out Streams
In the Fan-in and Fan-out chapter, you can learn how to support fan-in and fan-out use cases by using named destinations. The UI provides dedicated support for named destinations as well:
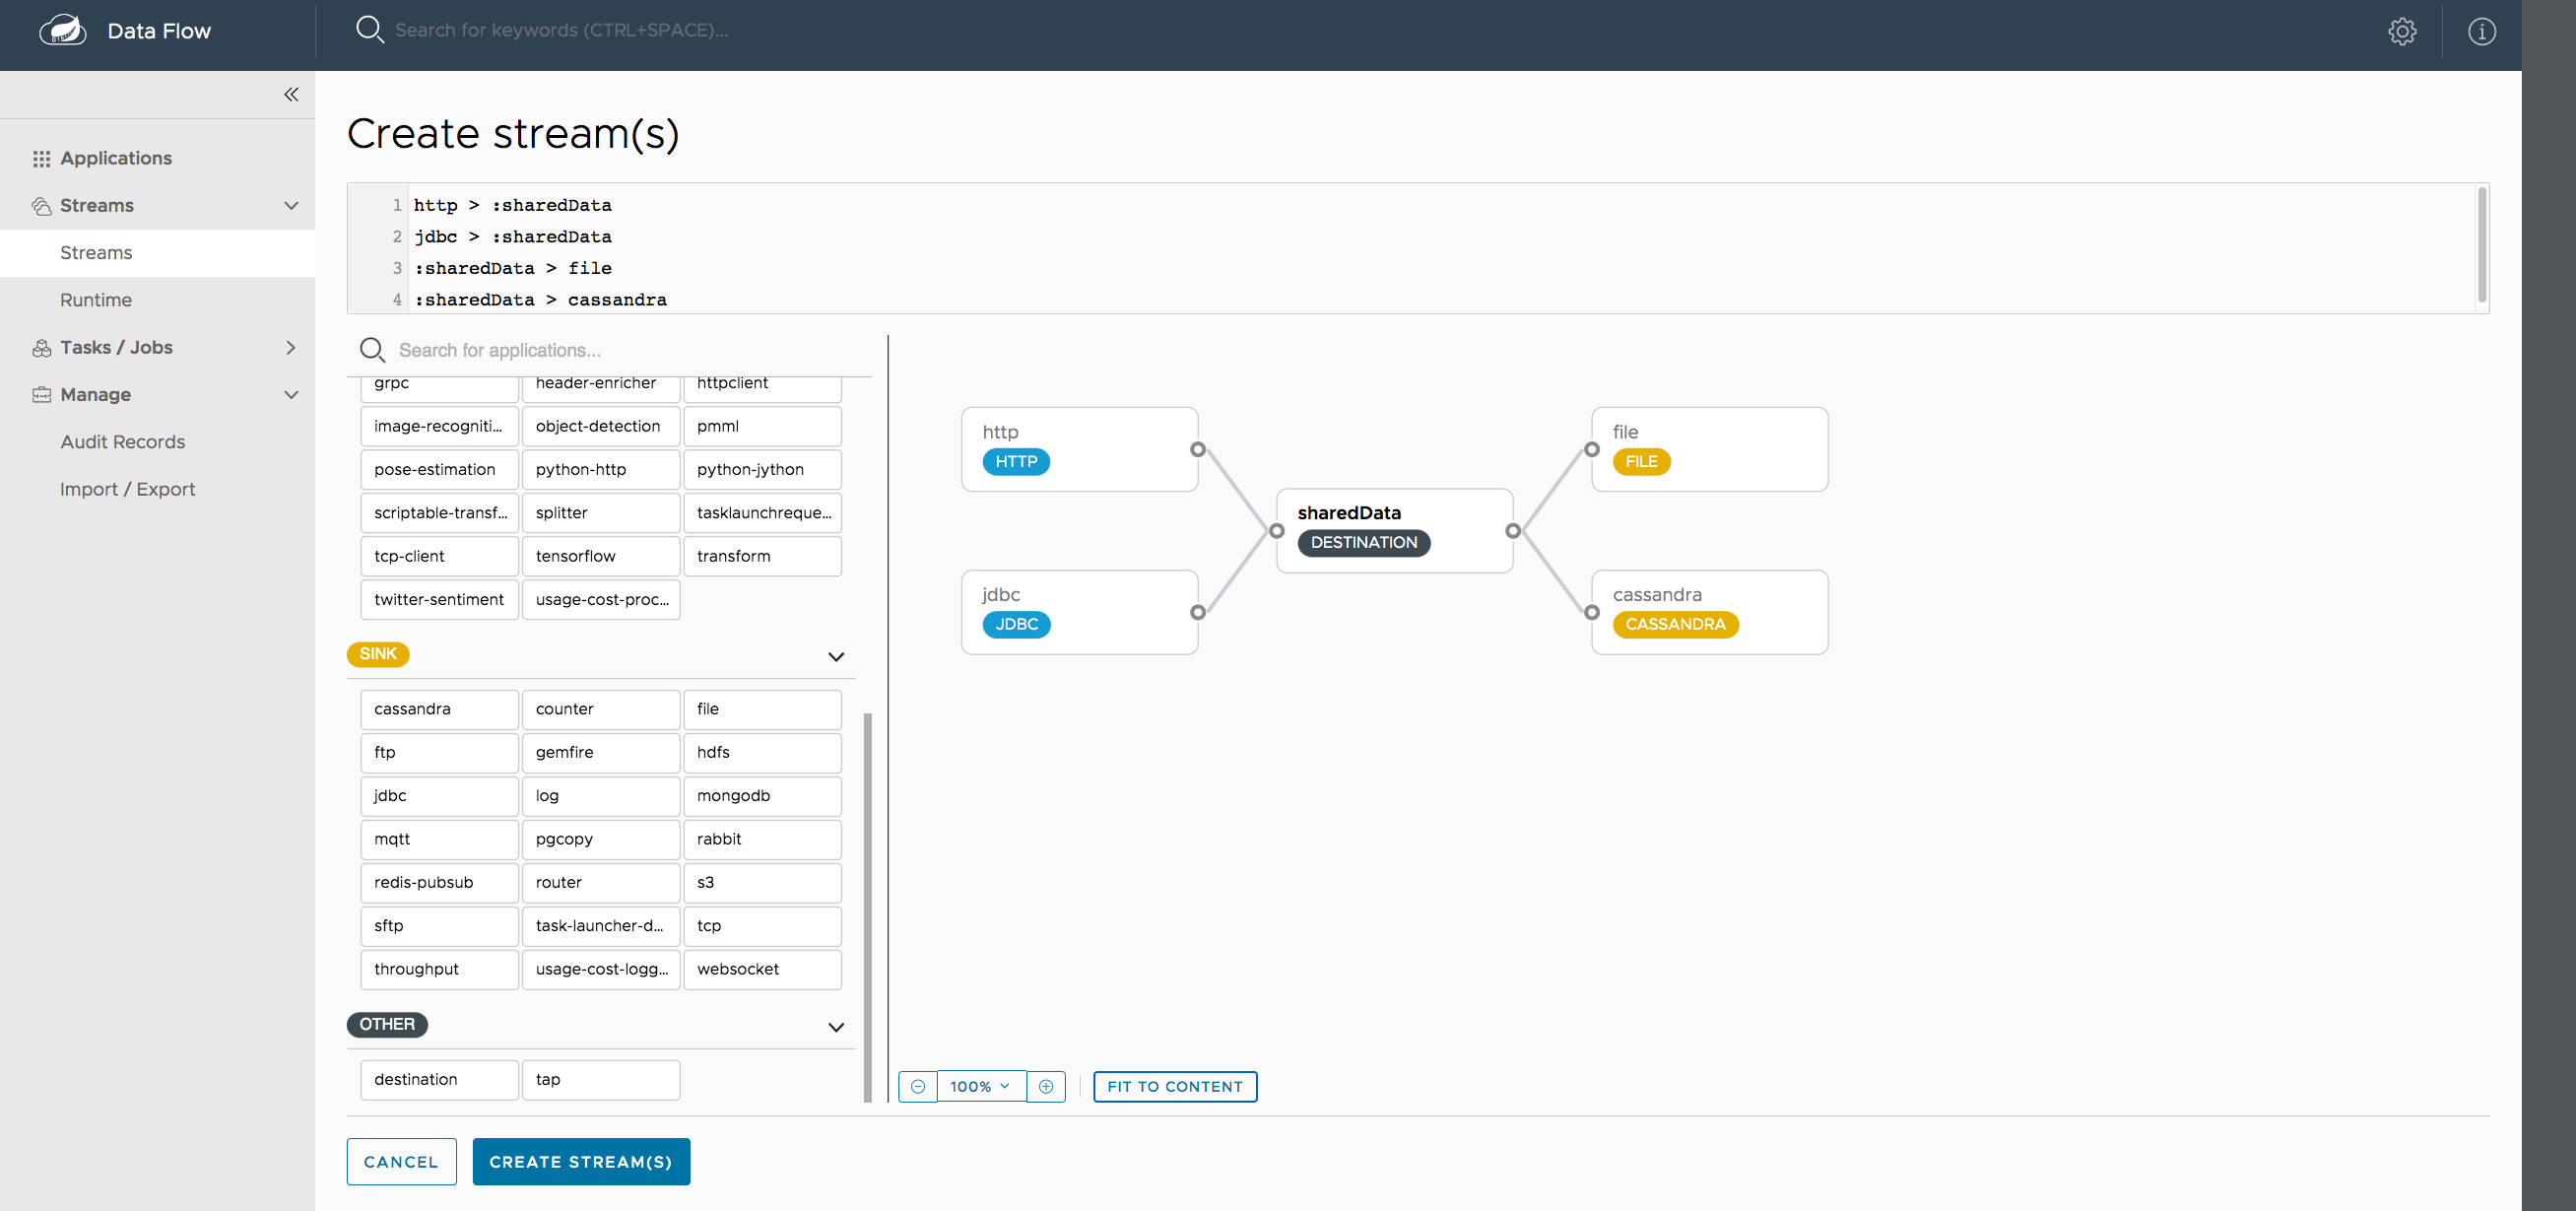
In this example, we have data from an HTTP Source and a JDBC Source that is being sent to the sharedData channel, which represents a fan-in use case. On the other end we have a Cassandra Sink and a File Sink subscribed to the sharedData channel, which represents a fan-out use case.
36.6. Creating a Tap Stream
Creating taps by using the Dashboard is straightforward. Suppose you have a stream consisting of an HTTP Source and a File Sink and you would like to tap into the stream to also send data to a JDBC Sink. To create the tap stream, connect the output connector of the HTTP Source to the JDBC Sink. The connection is displayed as a dotted line, indicating that you created a tap stream.
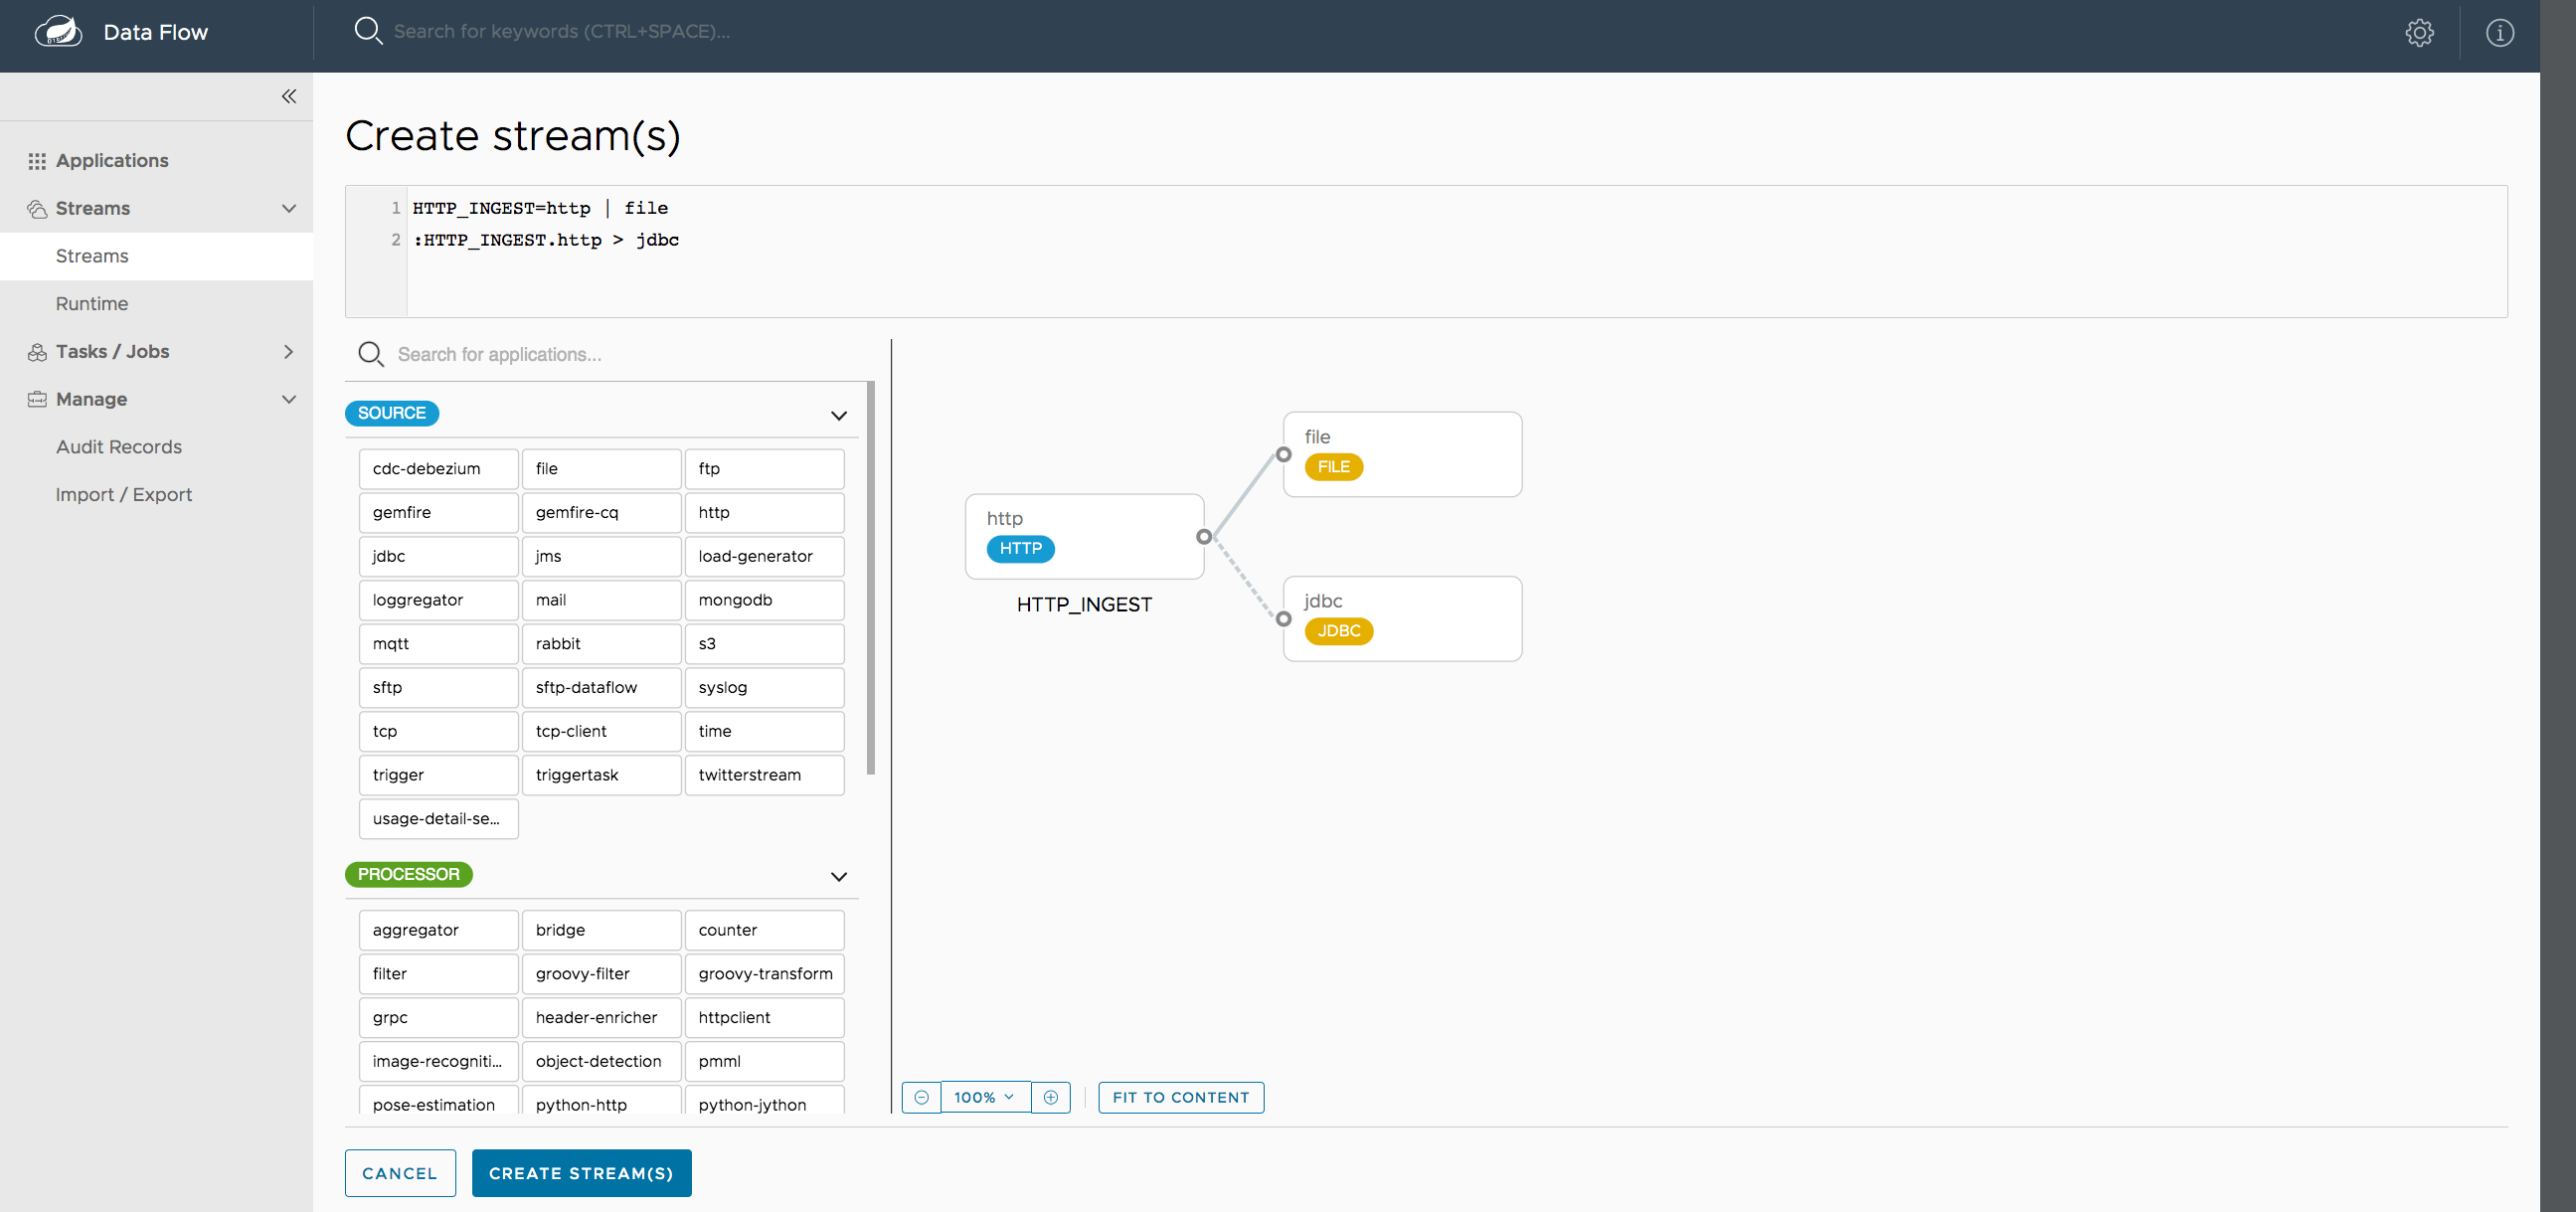
The primary stream (HTTP Source to File Sink) will be automatically named, in case you did not provide a name for the stream, yet. When creating tap streams, the primary stream must always be explicitly named. In the preceding image, the primary stream was named HTTP_INGEST.
By using the Dashboard, you can also switch the primary stream so that it becomes the secondary tap stream.
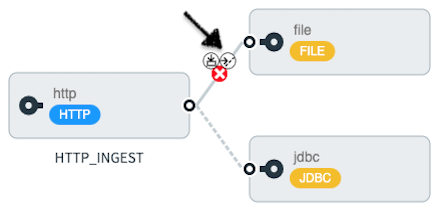
Hover over the existing primary stream, the line between HTTP Source and File Sink. Several control icons appear, and, by clicking on the icon labeled Switch to/from tap, you change the primary stream into a tap stream. Do the same for the tap stream and switch it to a primary stream.
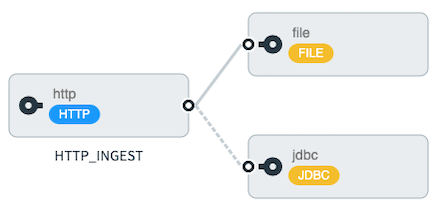
| When interacting directly with named destinations, there can be "n" combinations (Inputs/Outputs). This allows you to create complex topologies involving a wide variety of data sources and destinations. |
36.7. Import and Export Streams
The Import/Export tab of the Dashboard includes a page that provides the option to import and export streams.
The following image shows the streams export page:
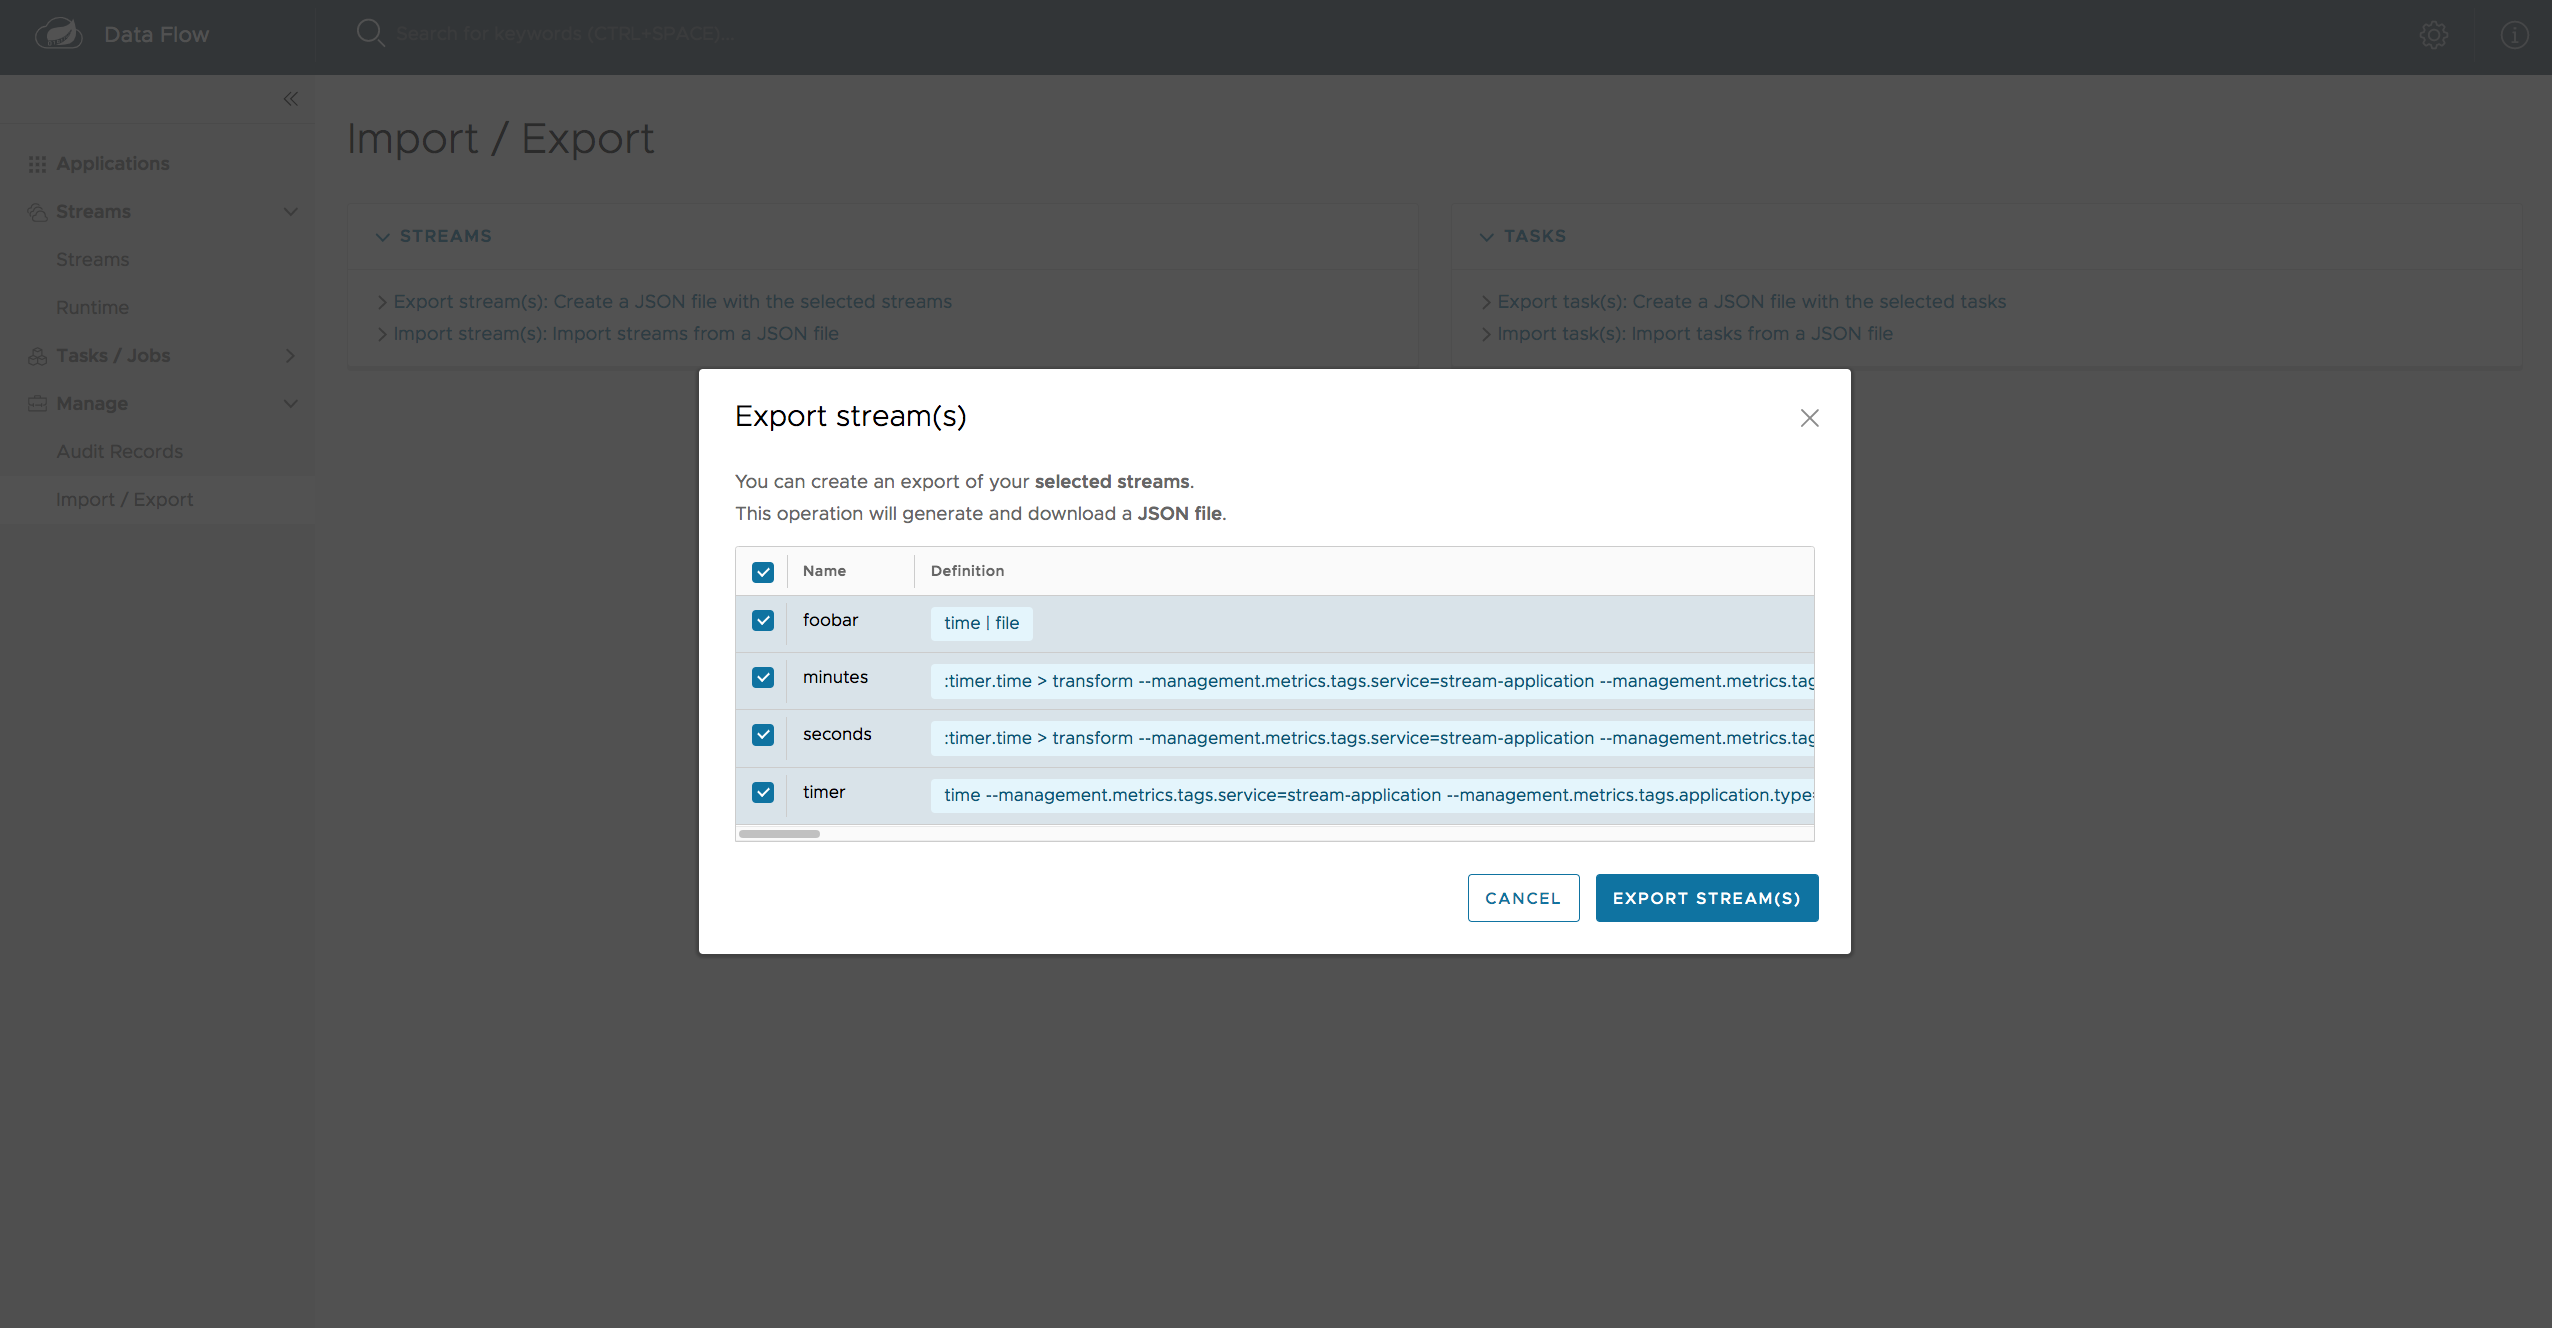
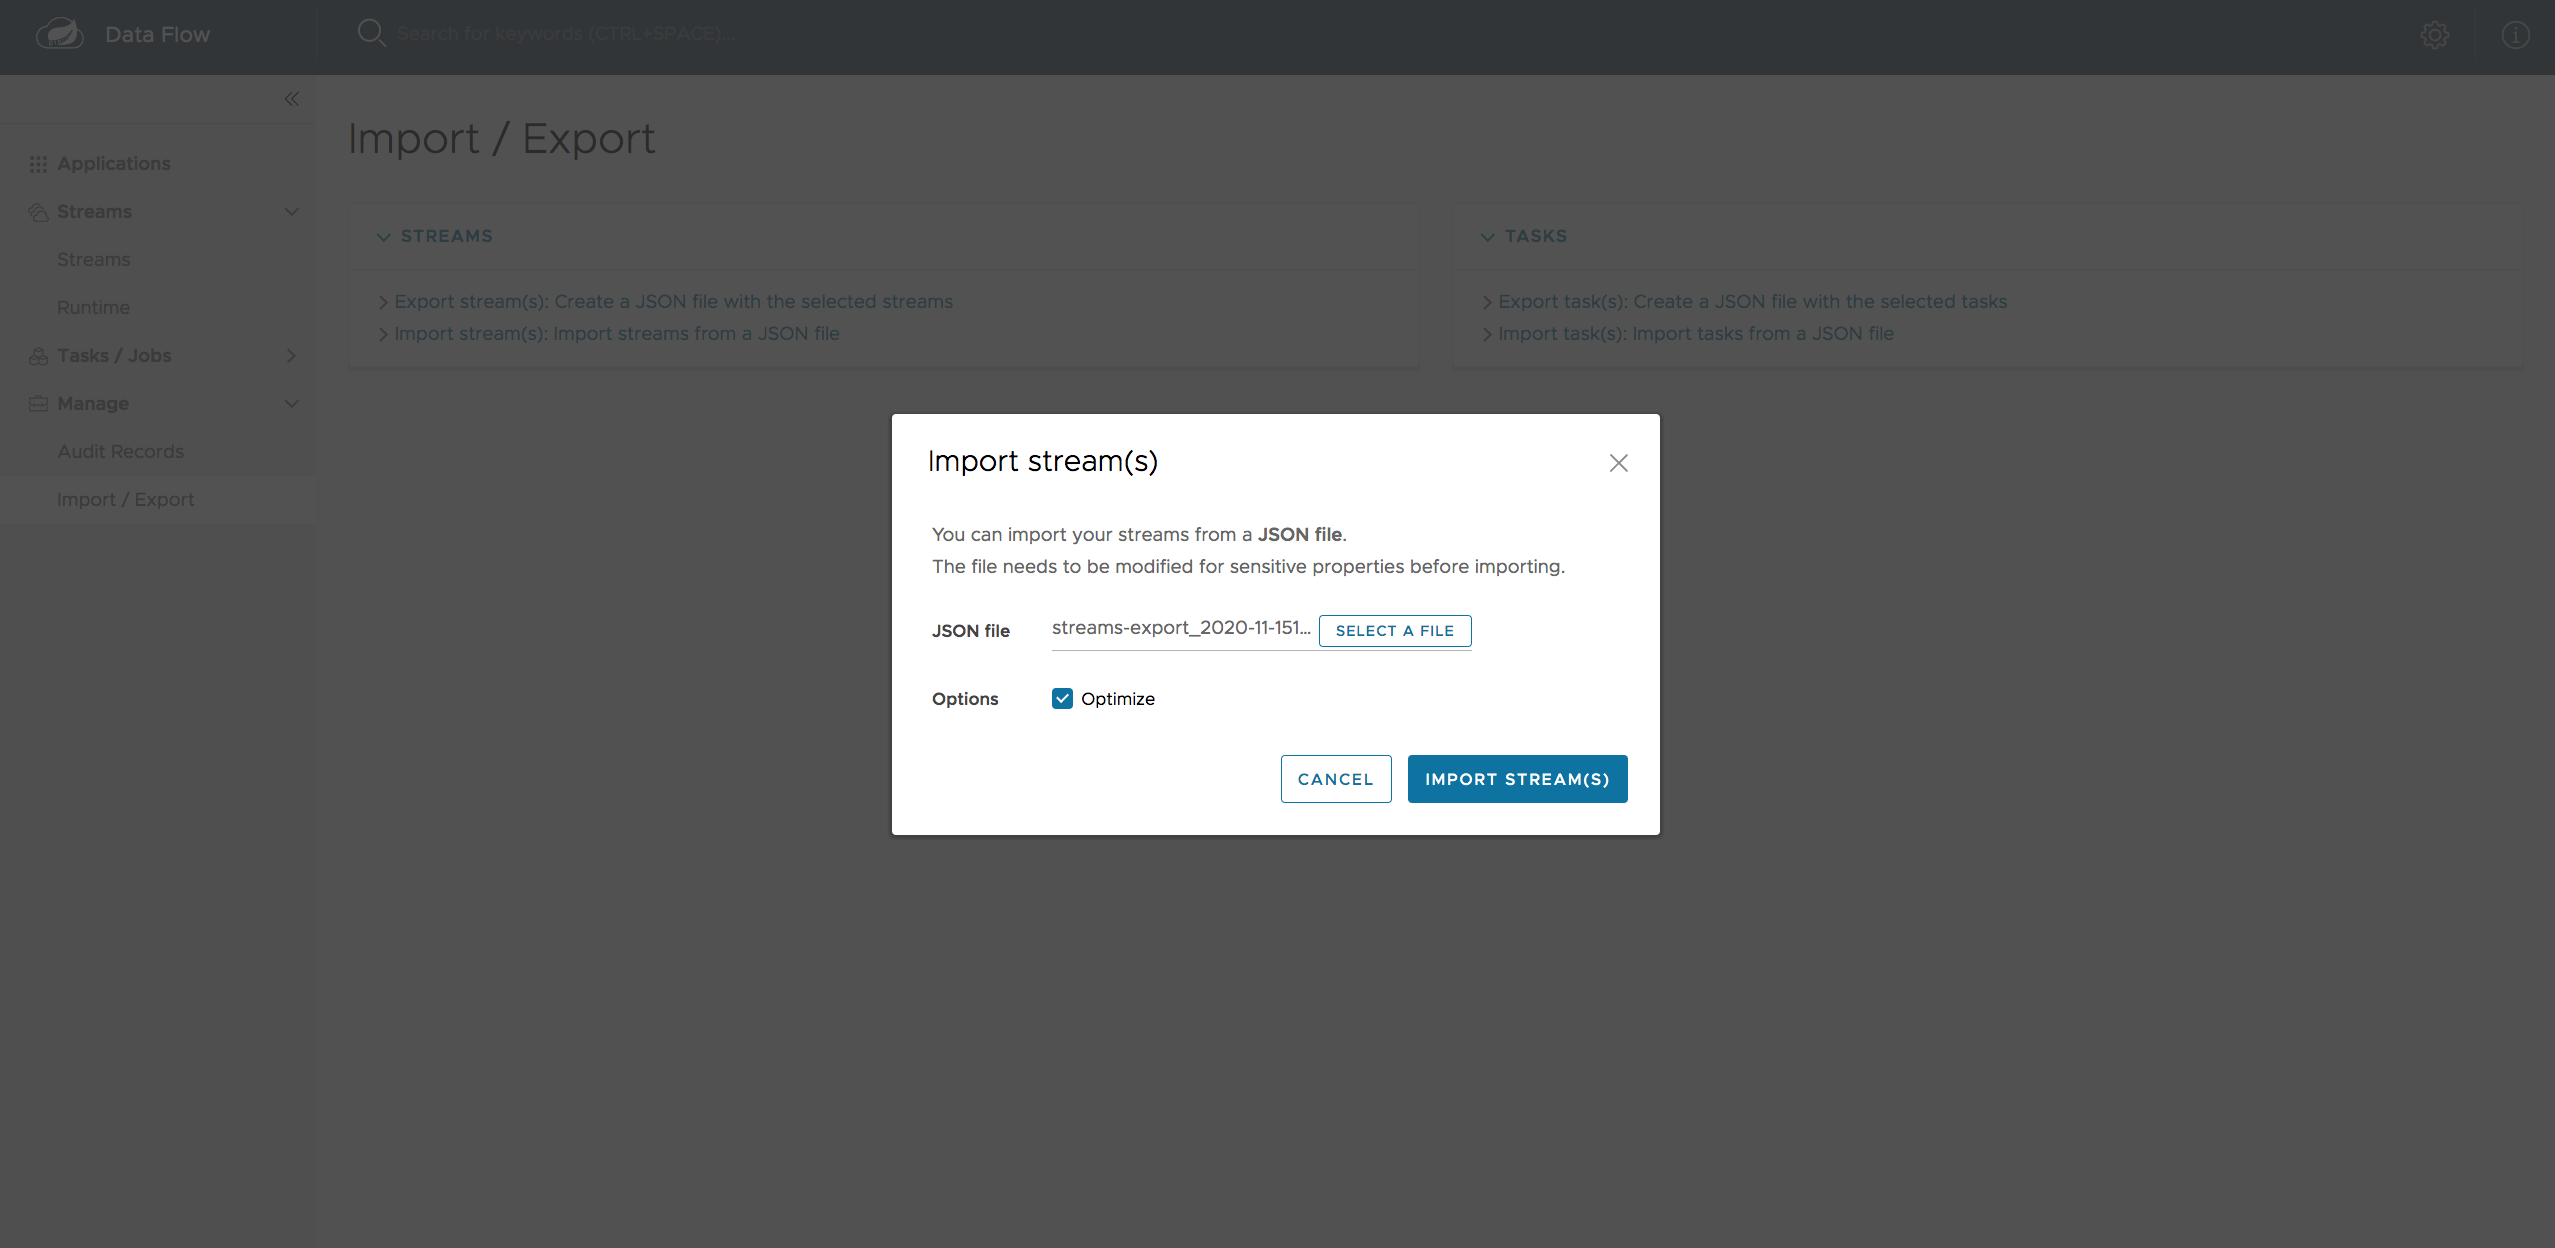
When importing the streams, you have to import from a valid JSON file. You can either manually draft the file or export the file from the streams export page.
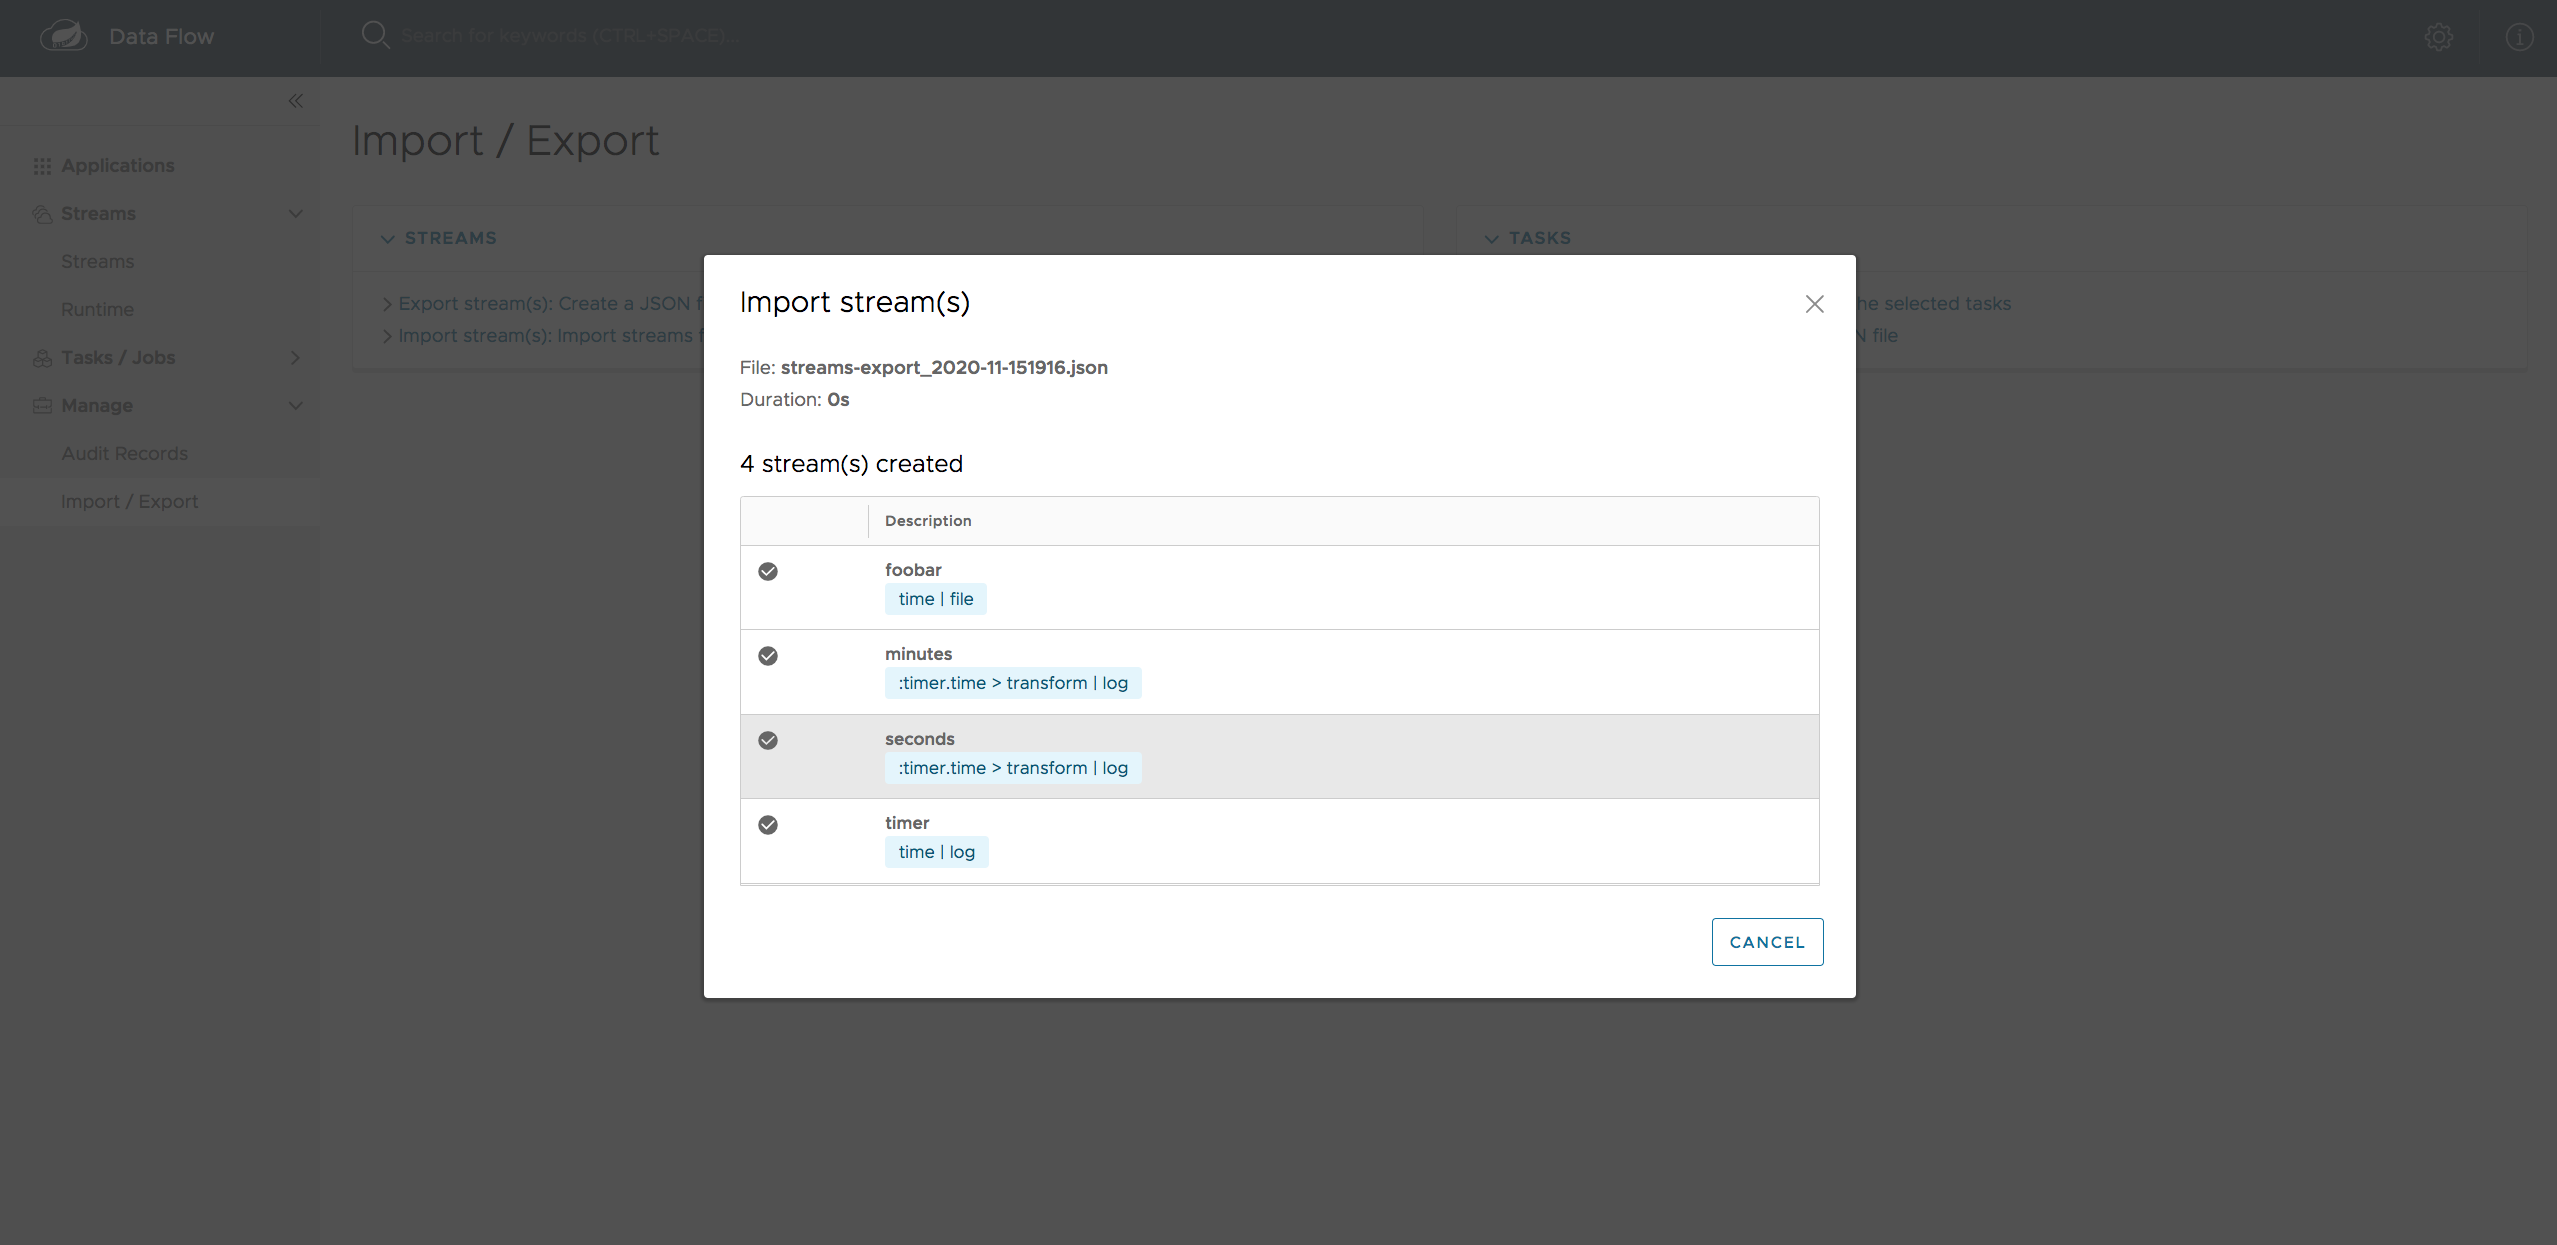
After importing the file, you get confirmation of whether the operation completed successfully.
37. Tasks
The Tasks tab of the Dashboard currently has three tabs:
37.1. Apps
Each application encapsulates a unit of work into a reusable component. Within the Data Flow runtime environment, applications let you create definitions for streams as well as tasks. Consequently, the Apps tab within the Tasks tab lets you create task definitions.
| You can also use this tab to create Batch Jobs. |
The following image shows a typical list of task applications:

On this screen, you can perform the following actions:
-
View details, such as the task application options.
-
Create a task definition from the respective application.
37.1.1. View Task Application Details
On this page, you can view the details of a selected task application, including the list of available options (properties) for that application.
37.2. Definitions
This page lists the Data Flow task definitions and provides actions to launch or destroy those tasks.
The following image shows the Definitions page:

37.2.1. Create a Task Definition
The following image shows a task definition composed of the timestamp application as well as the list of task applications that can be used to create a task definiton:
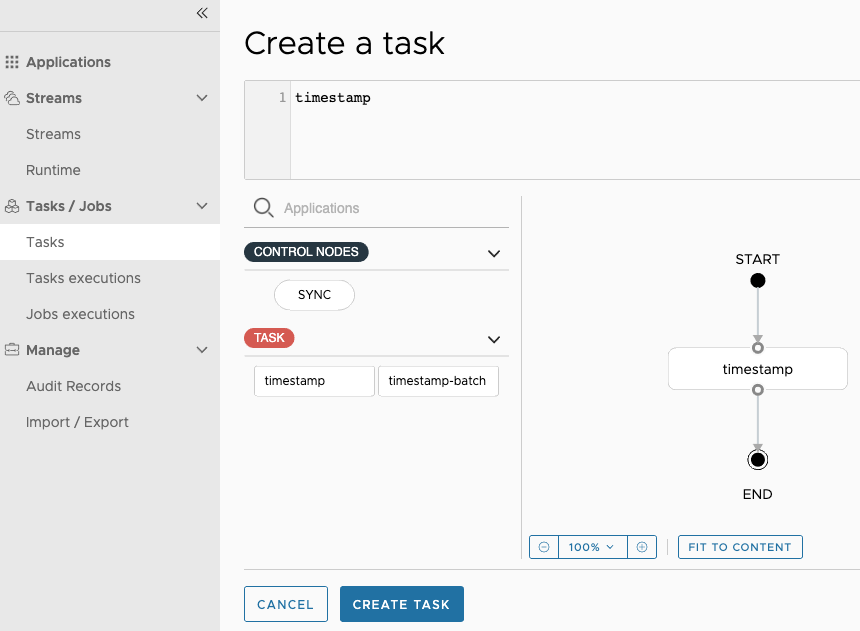
On this page, you can also specify various properties that are used during the deployment of the application. Once you are satisfied with the task definition, you can click the CREATE TASK button. A dialog box then asks for a task definition name and description. At a minimum, you must provide a name for the new definition.
37.2.2. Creating Composed Task Definitions
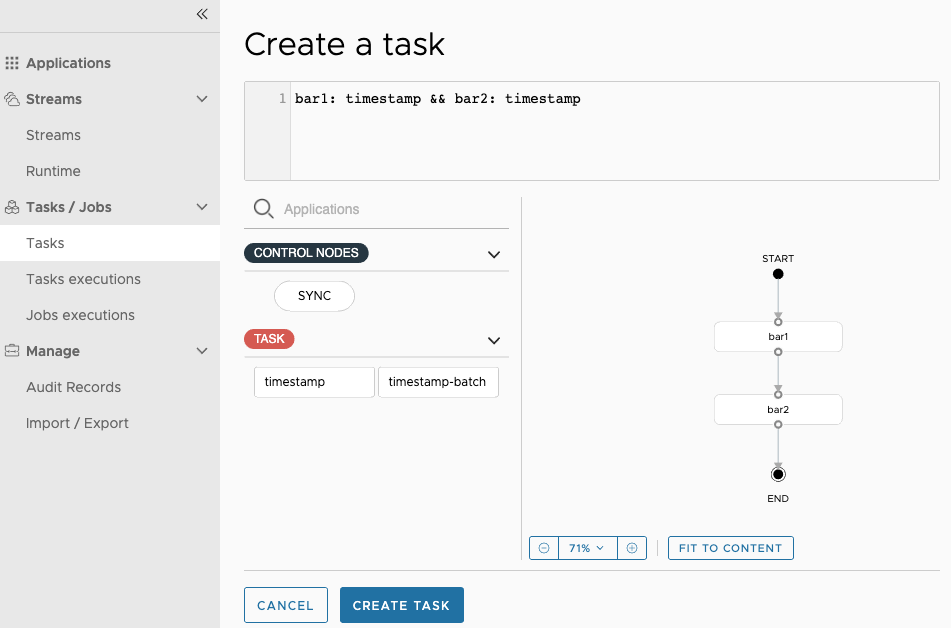
The dashboard includes the Create Composed Task tab, which provides an interactive graphical interface for creating composed tasks.
In this tab, you can:
-
Create and visualize composed tasks by using DSL, a graphical canvas, or both.
-
Use auto-adjustment and grid-layout capabilities in the GUI for simpler and interactive organization of the composed task.
On the Create Composed Task screen, you can define one or more task parameters by entering both the parameter key and the parameter value.
| Task parameters are not typed. |
The following image shows the composed task designer:
37.2.3. Launching Tasks
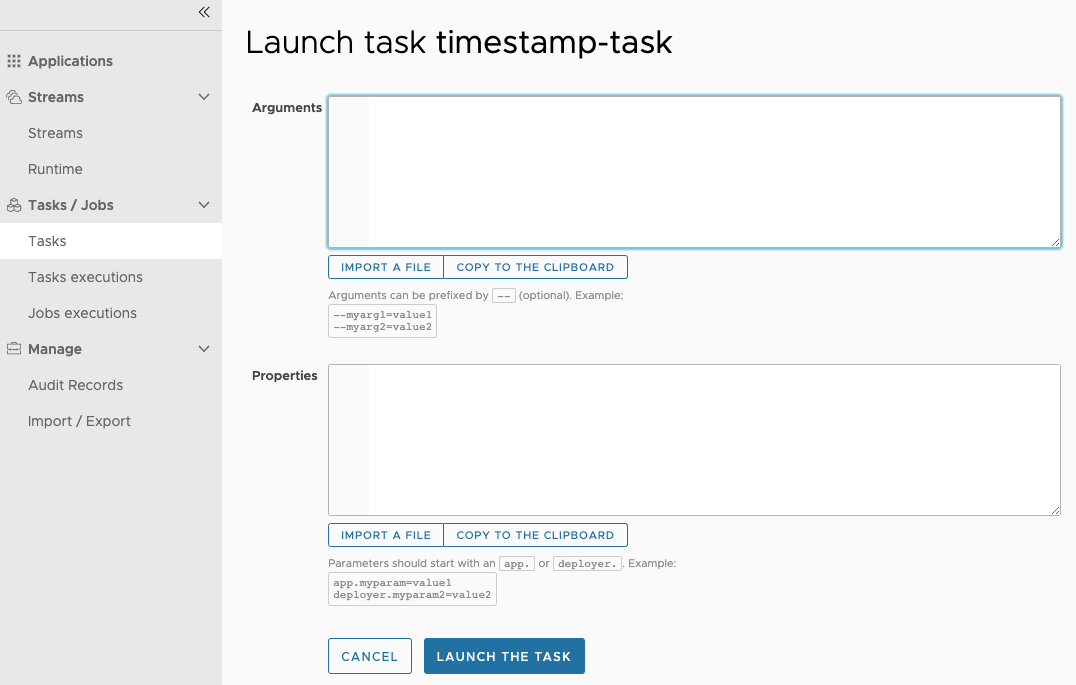
Once the task definition has been created, you can launch the tasks through the dashboard.
To do so, click the Tasks tab and select the task you want to launch by pressing Launch.
The following image shows the Task Launch page:
37.2.4. Import/Export Tasks
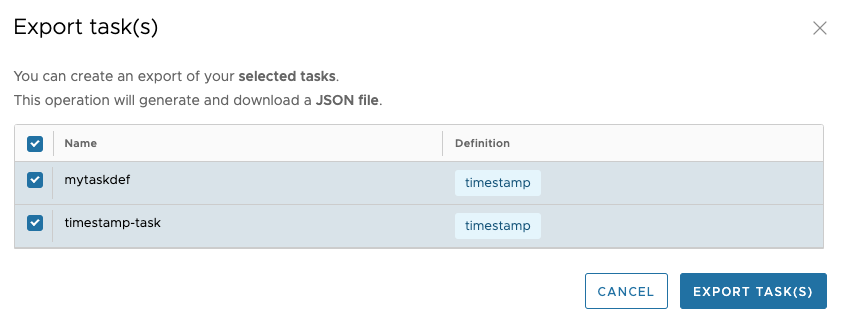
The Import/Export page provides the option to import and export tasks. This is done by clicking the Import/Export option on the left side of page. From here, click the Export task(s): Create a JSON file with the selected tasks option. The Export Tasks(s) page appears.
The following image shows the tasks export page:
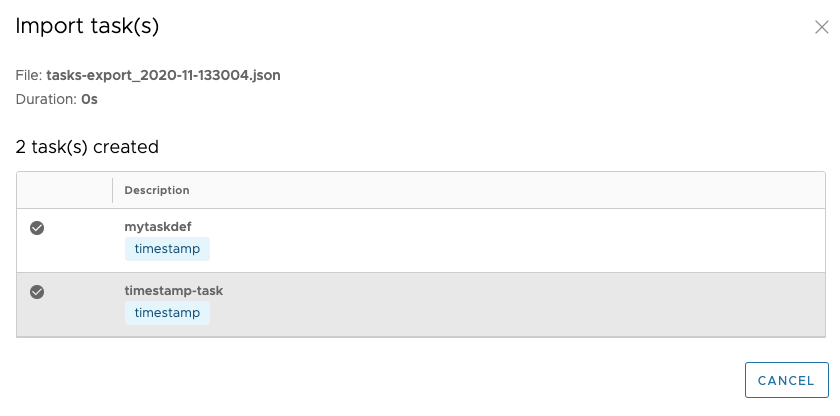
Similarly, you can import task definitions. To do so, click the Import/Export option on the left side of page. From here, click the Import task(s): Import tasks from a JSON file option to show the Import Tasks page. On the Import Tasks page, you have to import from a valid JSON file. You can either manually draft the file or export the file from the Tasks Export page.
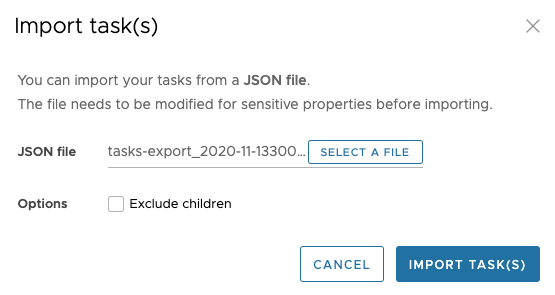
After importing the file, you get confirmation on whether the operation completed successfully.
37.3. Executions
The Task Executions tab shows the current running and completed task executions. From this page, you can drill down into the Task Execution details page. Furthermore, you can relaunch a Task Execution or stop a running execution.
Finally, you can clean up one or more task executions. This operation removes any associated task or batch job from the underlying persistence store. This operation can only be triggered for parent task executions and cascades down to the child task executions (if there are any).
The following image shows the Executions tab:

37.4. Execution Detail
For each task execution on the Task Executions tab, you can retrieve detailed information about a specific execution by clicking the Execution ID of the task execution.
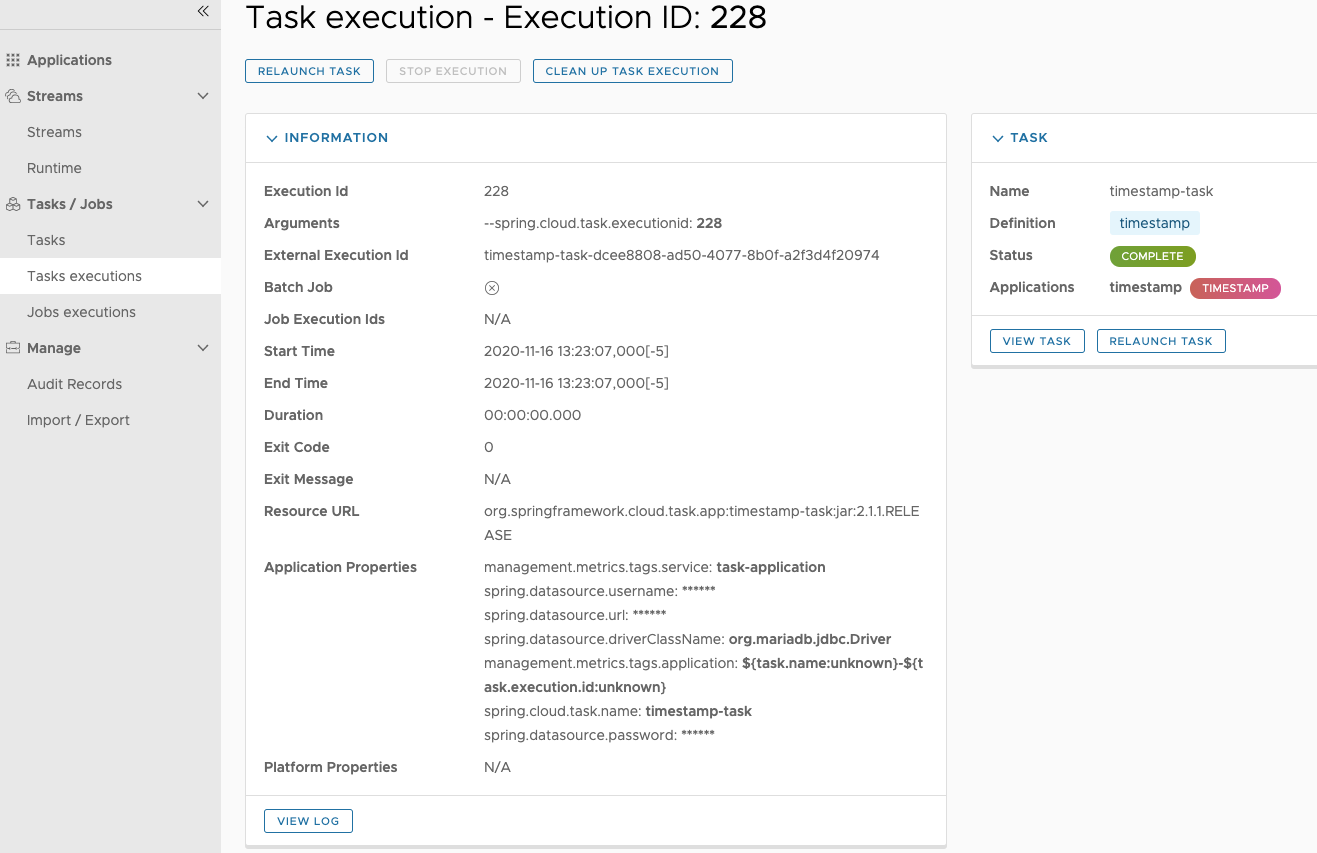
On this screen, you can view not only the information from the task executions page but also:
-
Task Arguments
-
External Execution ID
-
Batch Job Indicator (indicates if the task execution contained Spring Batch jobs.)
-
Job Execution IDs links (Clicking the Job Execution Id will take you to the Job Execution Details for that Job Execution ID.)
-
Task Execution Duration
-
Task Execution Exit Message
-
Logging output from the Task Execution
Additionally, you can trigger the following operations:
-
Relaunch a task
-
Stop a running task
-
Task execution cleanup (for parent task executions only)
37.4.1. Stop Executing Tasks
To submit a stop task execution request to the platform, click the drop down button next to the task execution that needs to be stopped.
Now click the Stop task option. The dashboard presents a dialog box asking if you are sure that you want to stop the task execution. If so, click Stop Task Execution(s).

| Child Spring Cloud Task applications launched via Spring Batch applications that use remote partitioning are not stopped. |
38. Jobs
The Job Executions tab of the Dashboard lets you inspect batch jobs. The main section of the screen provides a list of job executions. Batch jobs are tasks that each execute one or more batch jobs. Each job execution has a reference to the task execution ID (in the Task ID column).
The list of job executions also shows the state of the underlying Job Definition. Thus, if the underlying definition has been deleted, “No definition found” appears in the Status column.
You can take the following actions for each job:
-
Restart (for failed jobs).
-
Stop (for running jobs).
-
View execution details.
| Clicking the stop button actually sends a stop request to the running job, which may not immediately stop. |
The following image shows the Jobs tab:

38.1. Job Execution Details
After you have launched a batch job, the Job Execution Details page shows information about the job.
The following image shows the Job Execution Details page:
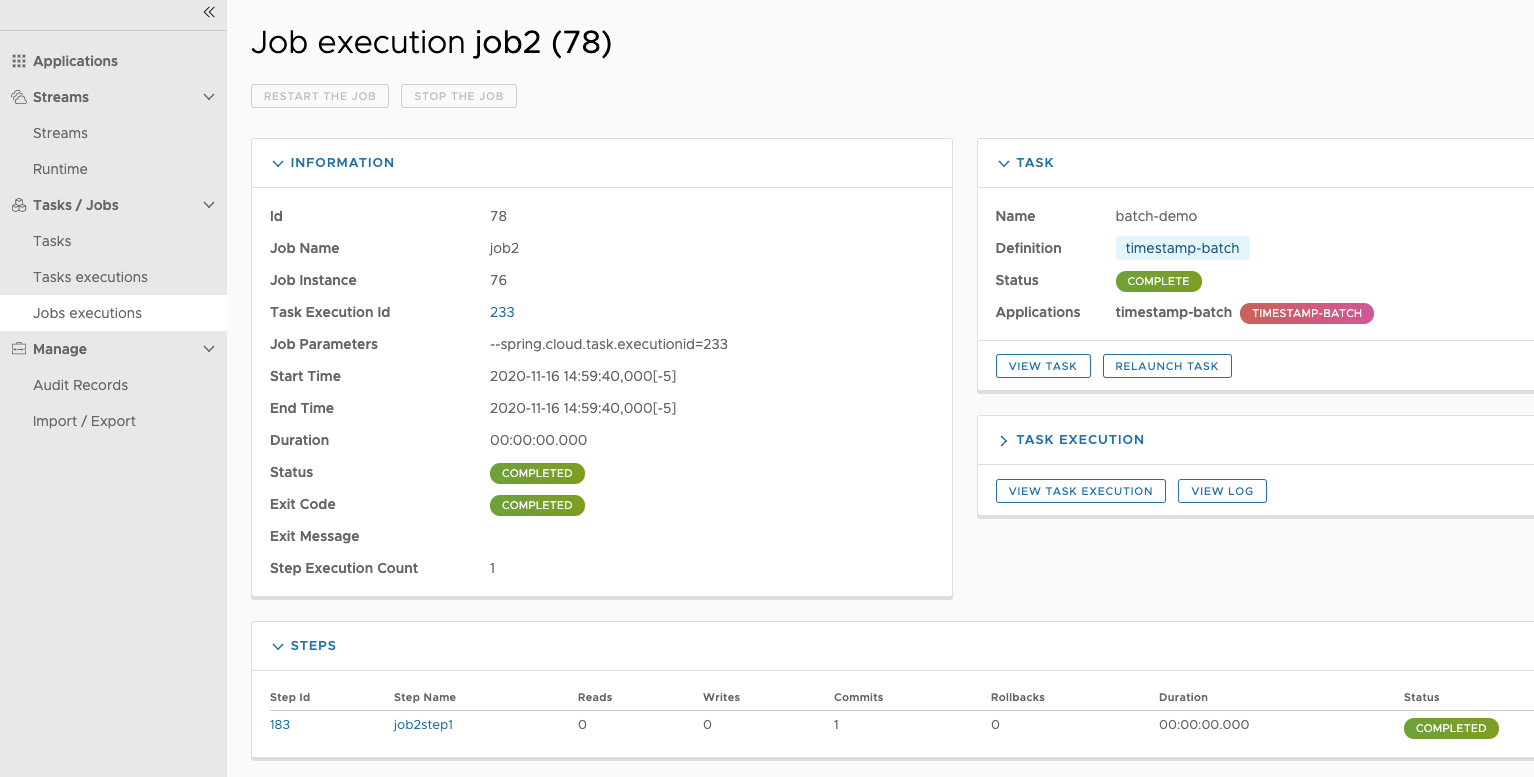
The Job Execution Details page contains a list of the executed steps. You can further drill into the details of each step’s execution by clicking the magnifying glass icon.
38.2. Step Execution Details
The Step Execution Details page provides information about an individual step within a job.
The following image shows the Step Execution Details page:
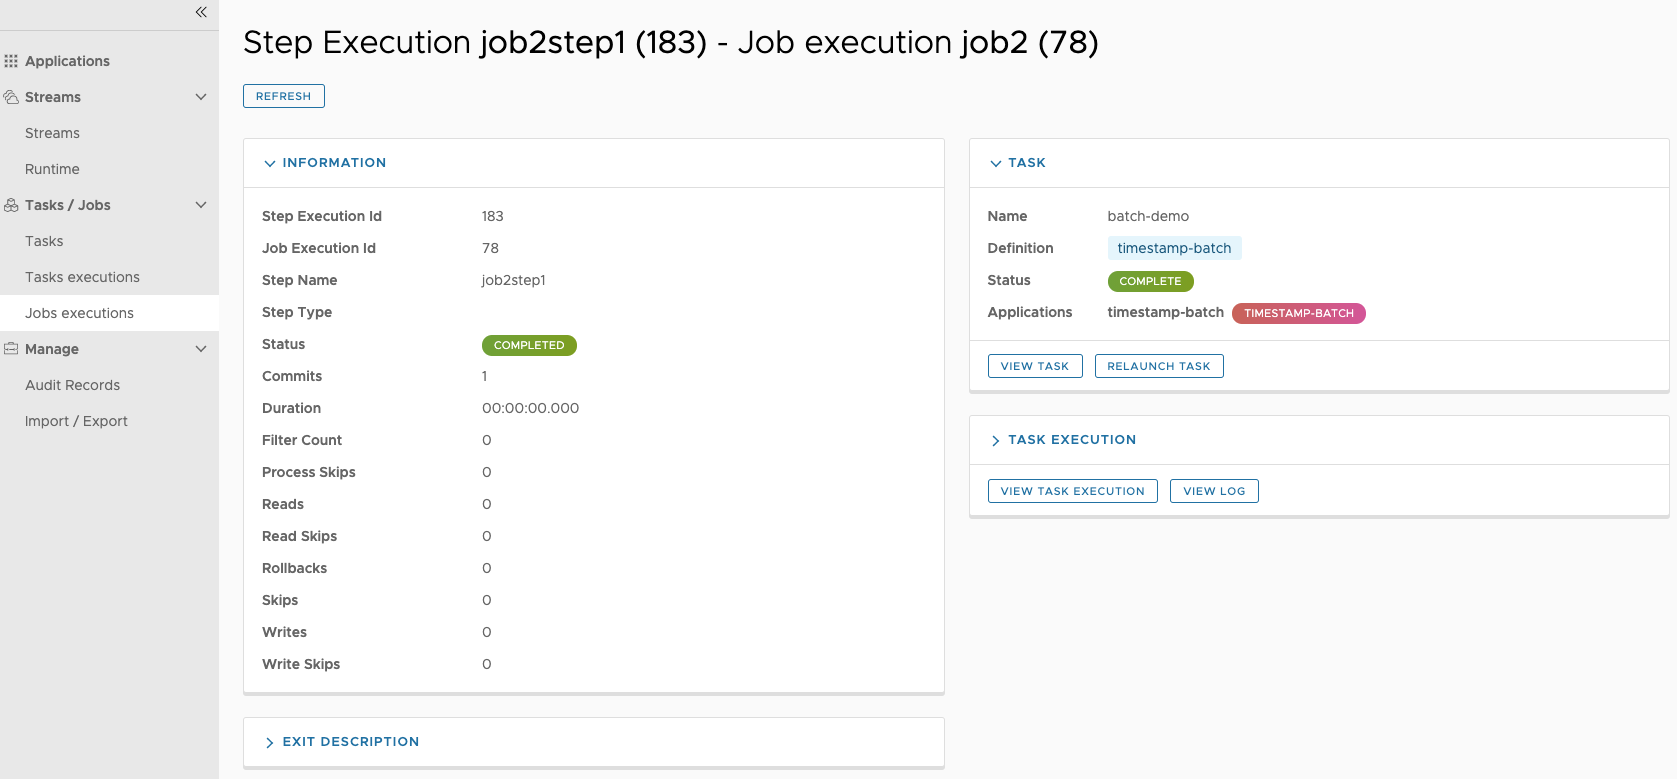
The Step Execution Details screen provides a complete list of all Step Execution Context key-value pairs.
| For exceptions, the Exit Description field contains additional error information. However, this field can have a maximum of 2500 characters. Therefore, in the case of long exception stack traces, trimming of error messages may occur. When that happens, check the server log files for further details. |
38.3. Step Execution History
Under Step Execution History, you can also view various metrics associated with the selected step, such as duration, read counts, write counts, and others across all of its executions. For each metric there are 5 attributes:
-
Count - The number of step executions that the metric could have participated. It is not a count for the number of times the event occurred during each step execution.
-
Min - The minimum value for the metric across all the executions for this step.
-
Max - The maximum value for the metric across all the executions for this step.
-
Mean - The mean value for the metric across all the executions for this step.
-
Standard Deviation - The standard deviation for the metric across all the executions for this step.
The Step Execution contains the following metrics:
-
Commit Count - The max, min, mean, and standard deviation for the number of commits of all the executions for the given step.
-
Duration - The max, min, mean, and standard deviation for the duration of all the executions for the given step.
-
Duration Per Read - The max, min, mean, and standard deviation for the duration per read of all the executions for the given step.
-
FilterCount - The max, min, mean, and standard deviation for the number of filters of all the executions for the given step.
-
Process Skip Count - The max, min, mean, and standard deviation for the process skips of all the executions for the given step.
-
Read Count - The max, min, mean, and standard deviation for the number of reads of all the executions for the given step.
-
Read Skip Count - The max, min, mean, and standard deviation for the number of read skips of all the executions for the given step.
-
Rollback Count - The max, min, mean, and standard deviation for the number of rollbacks of all the executions for the given step.
-
Write Count - The max, min, mean, and standard deviation for the number of writes of all the executions for the given step.
-
Write Skip Count - The max, min, mean, and standard deviation for the number of skips of all the executions for the given step.
39. Scheduling
You can create schedules from the SCDF Dashboard for the Task Definitions. See the Scheduling Batch Jobs section of the microsite for more information.
40. Auditing
The Auditing page of the Dashboard gives you access to recorded audit events. Audit events are recorded for:
-
Streams
-
Create
-
Delete
-
Deploy
-
Undeploy
-
-
Tasks
-
Create
-
Delete
-
Launch
-
-
Scheduling of Tasks
-
Create Schedule
-
Delete Schedule
-
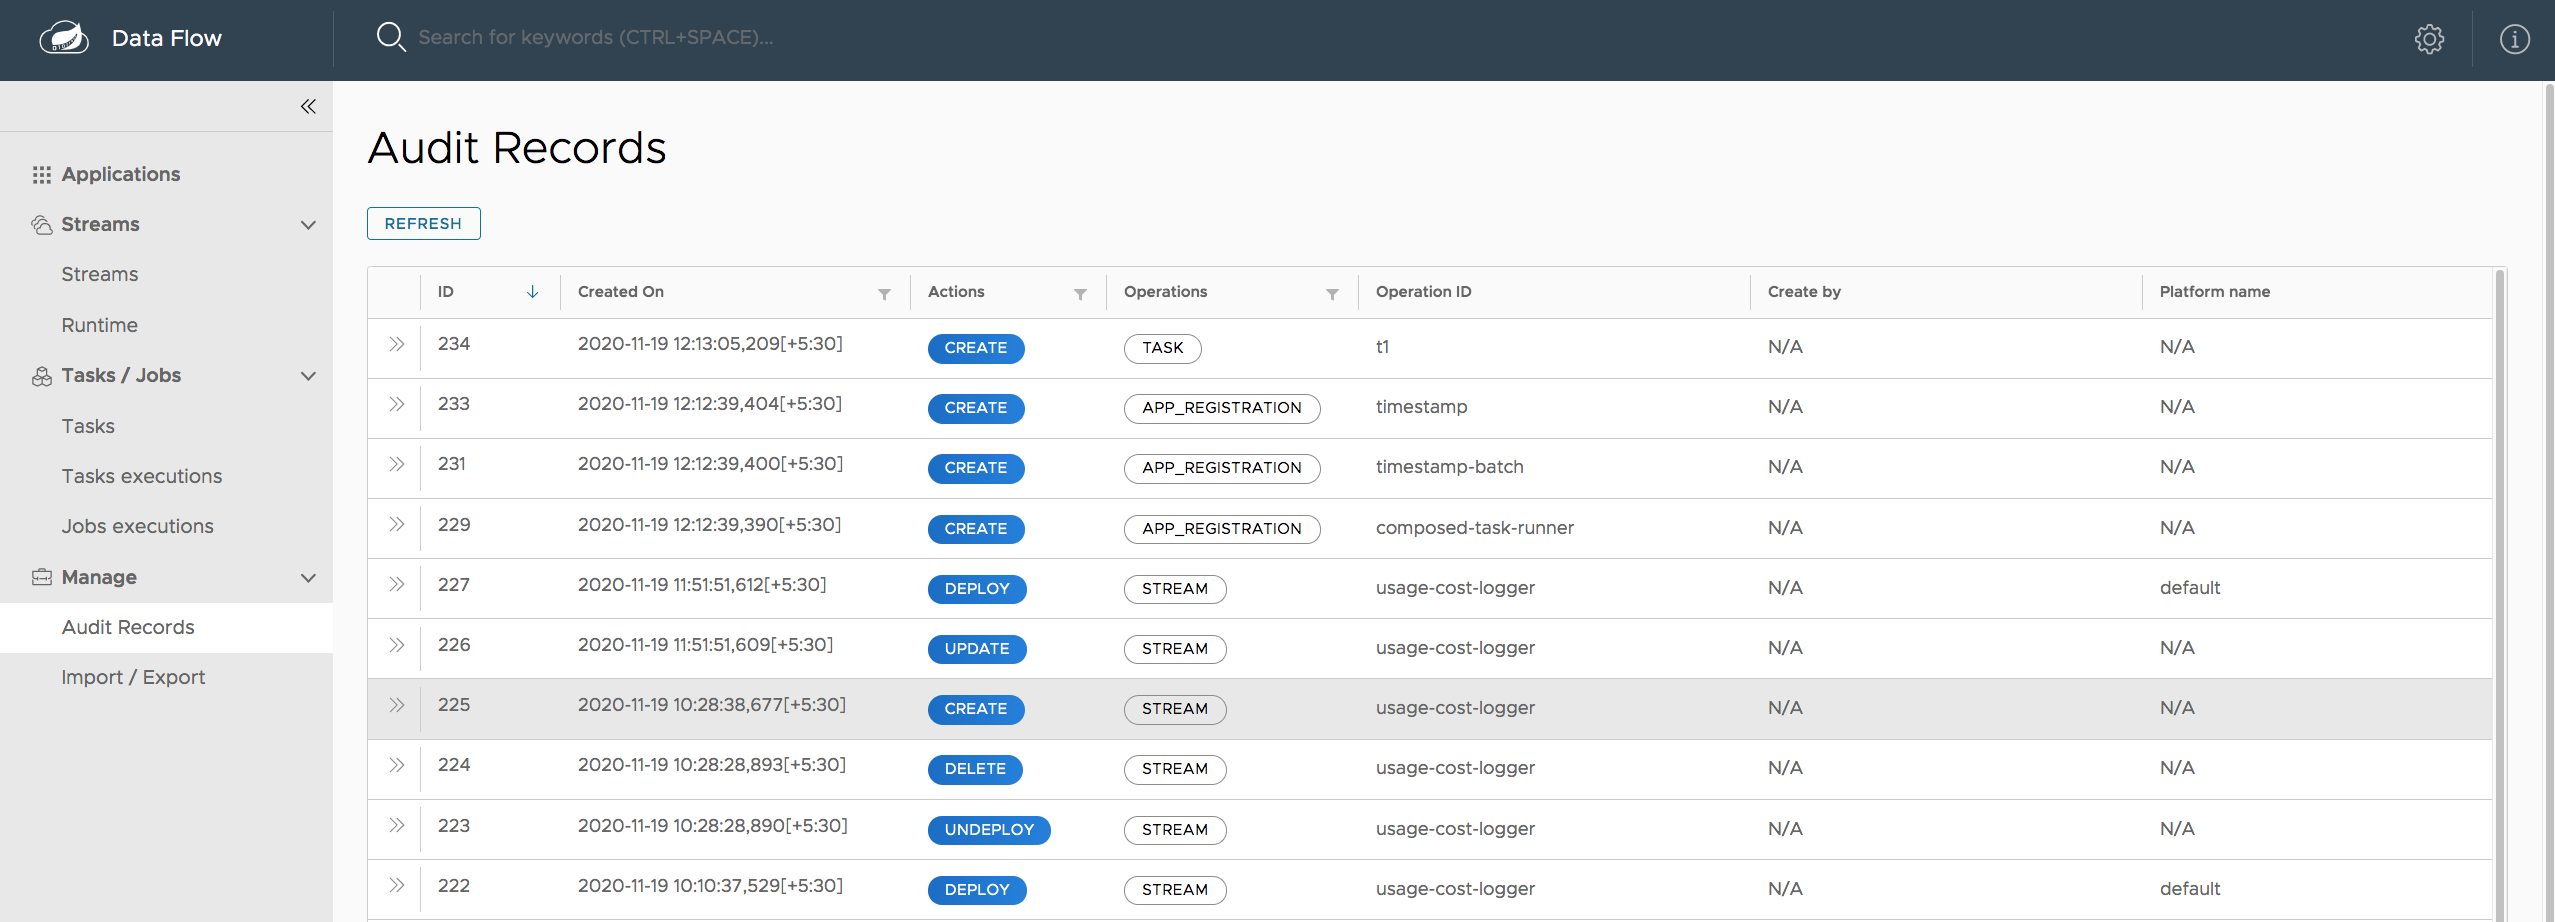
The following image shows the Audit Records page:
By clicking the show details icon (the “i” in a circle on the right), you can obtain further details regarding the auditing details:
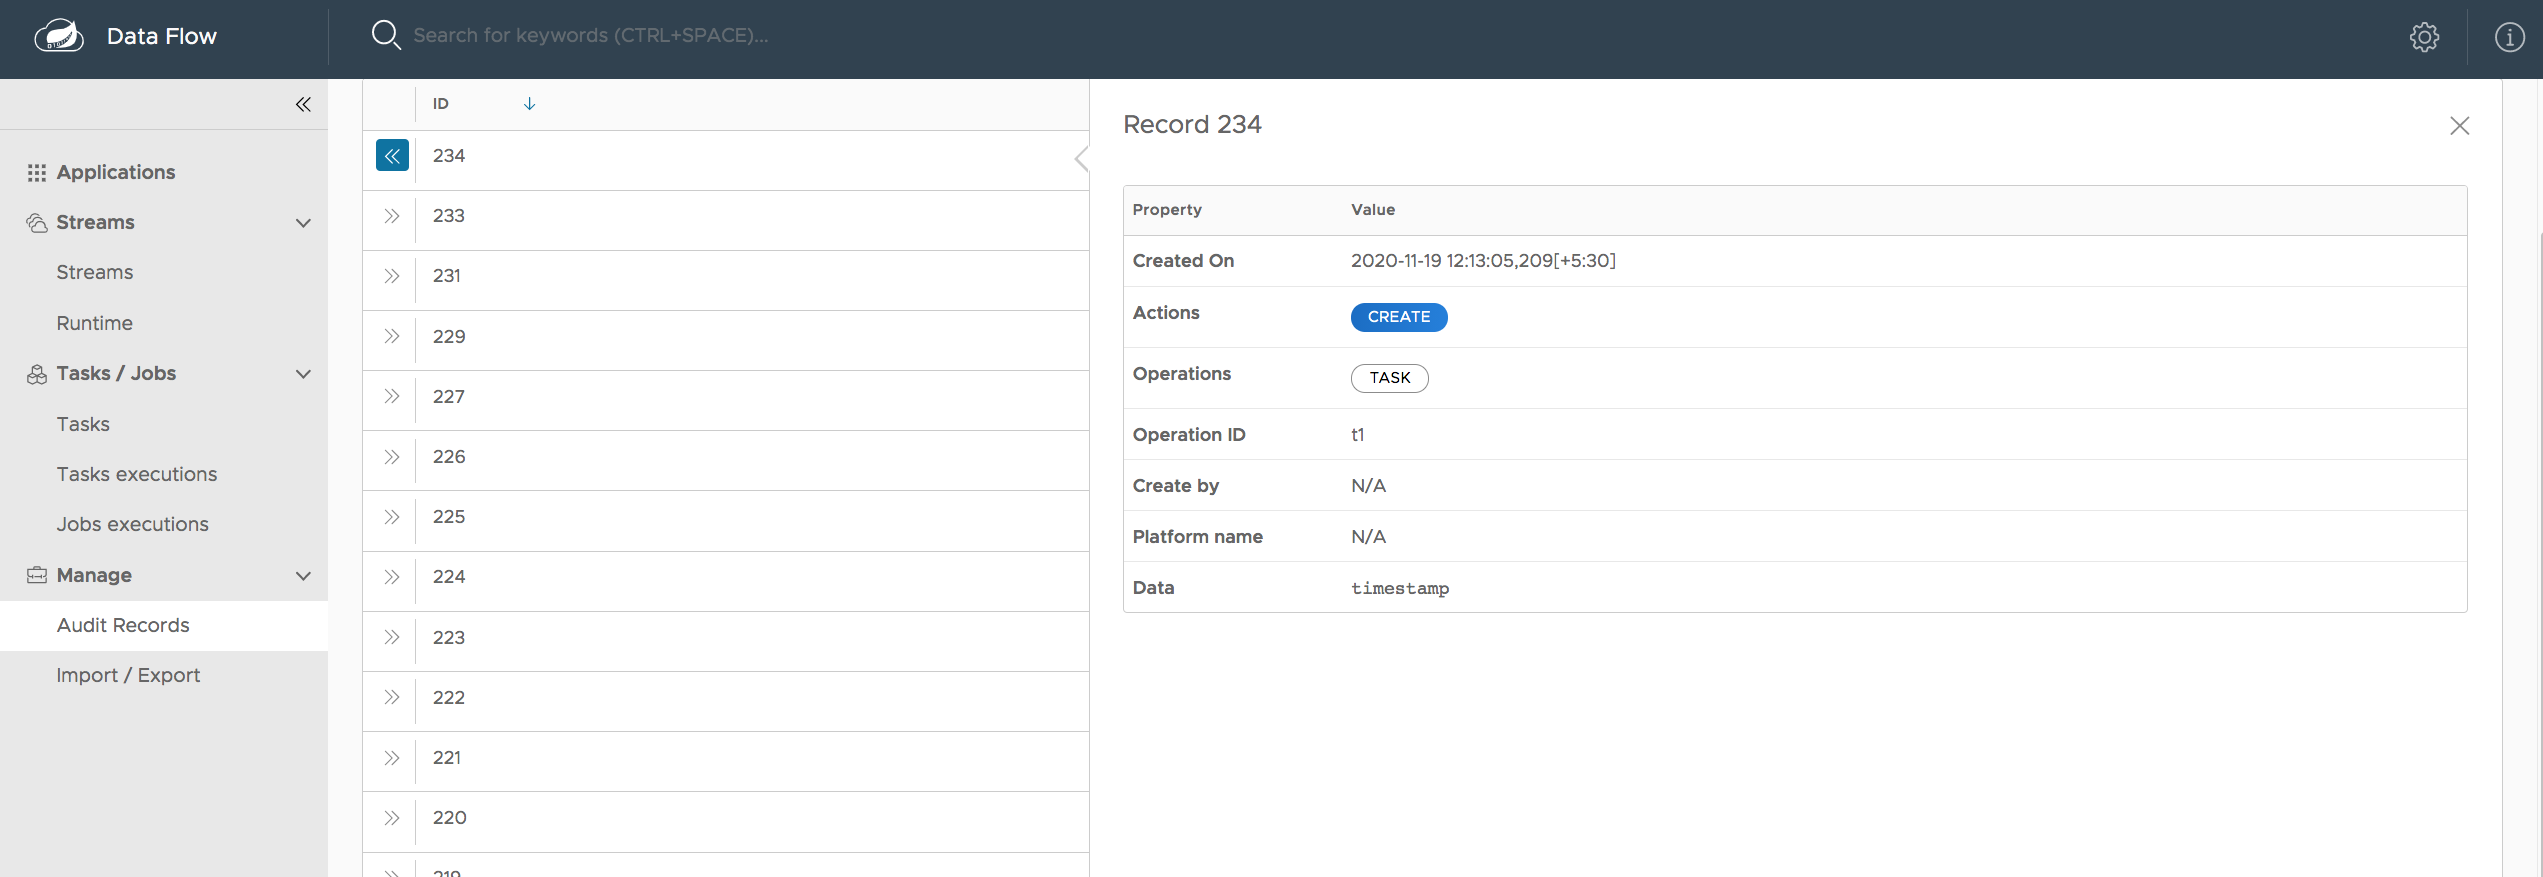
Generally, auditing provides the following information:
-
When was the record created?
-
The name of the user who triggered the audit event (if security is enabled)
-
Audit operation (Schedule, Stream, or Task)
-
The performed action (Create, Delete, Deploy, Rollback, Undeploy, or Update)
-
Correlation ID, such as the Stream or Task name
-
Audit Data
The written value of the audit data property depends on the performed audit operation and the action type. For example, when a schedule is being created, the name of the task definition, task definition properties, deployment properties, and command line arguments are written to the persistence store.
Sensitive information is sanitized prior to saving the Audit Record, in a best-effort manner. Any of the following keys are being detected and their sensitive values are masked:
-
password
-
secret
-
key
-
token
-
.*credentials.*
-
vcap_services